Fragmentation
This app allows you to import your fragmentation data into an mXrap database, then visualise and analyse the data. Analysis can be conducted in conjunction with other relevant data sources (including production data).
Changes include:
- New data import interface. Users can import either fixed/variable percentage or fixed/variable size data.
- Updated analysis tools:
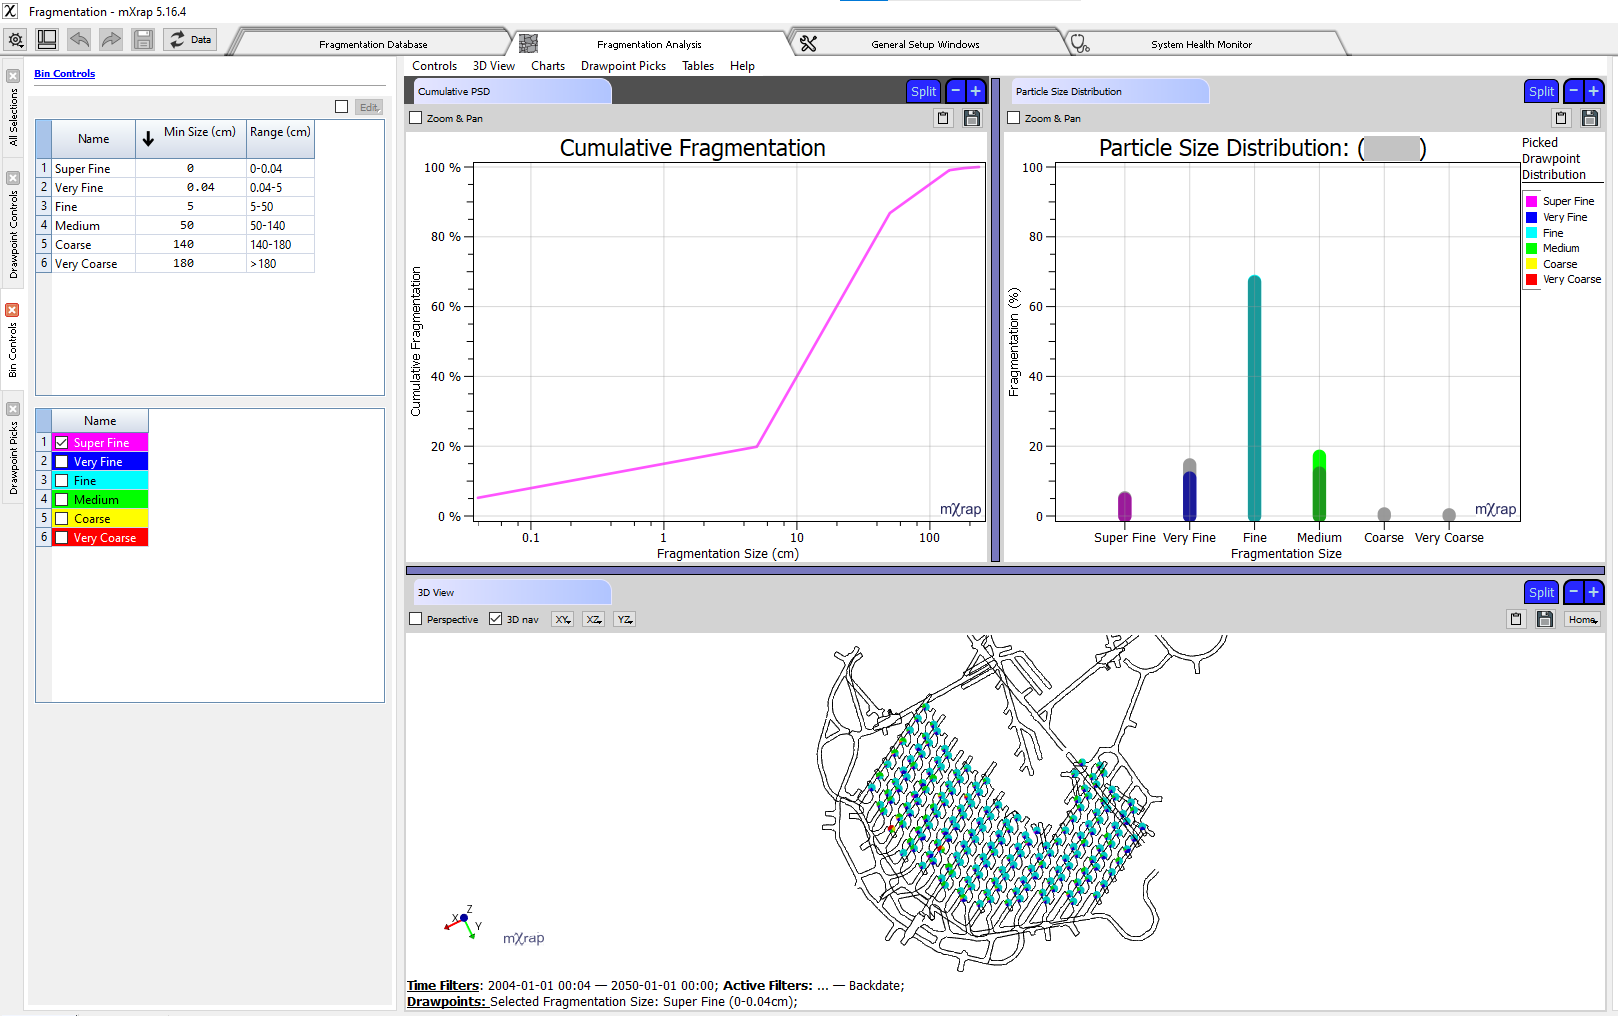
- Cumulative fragmentation chart
- Particle size distribution chart
- User defined bin sizes
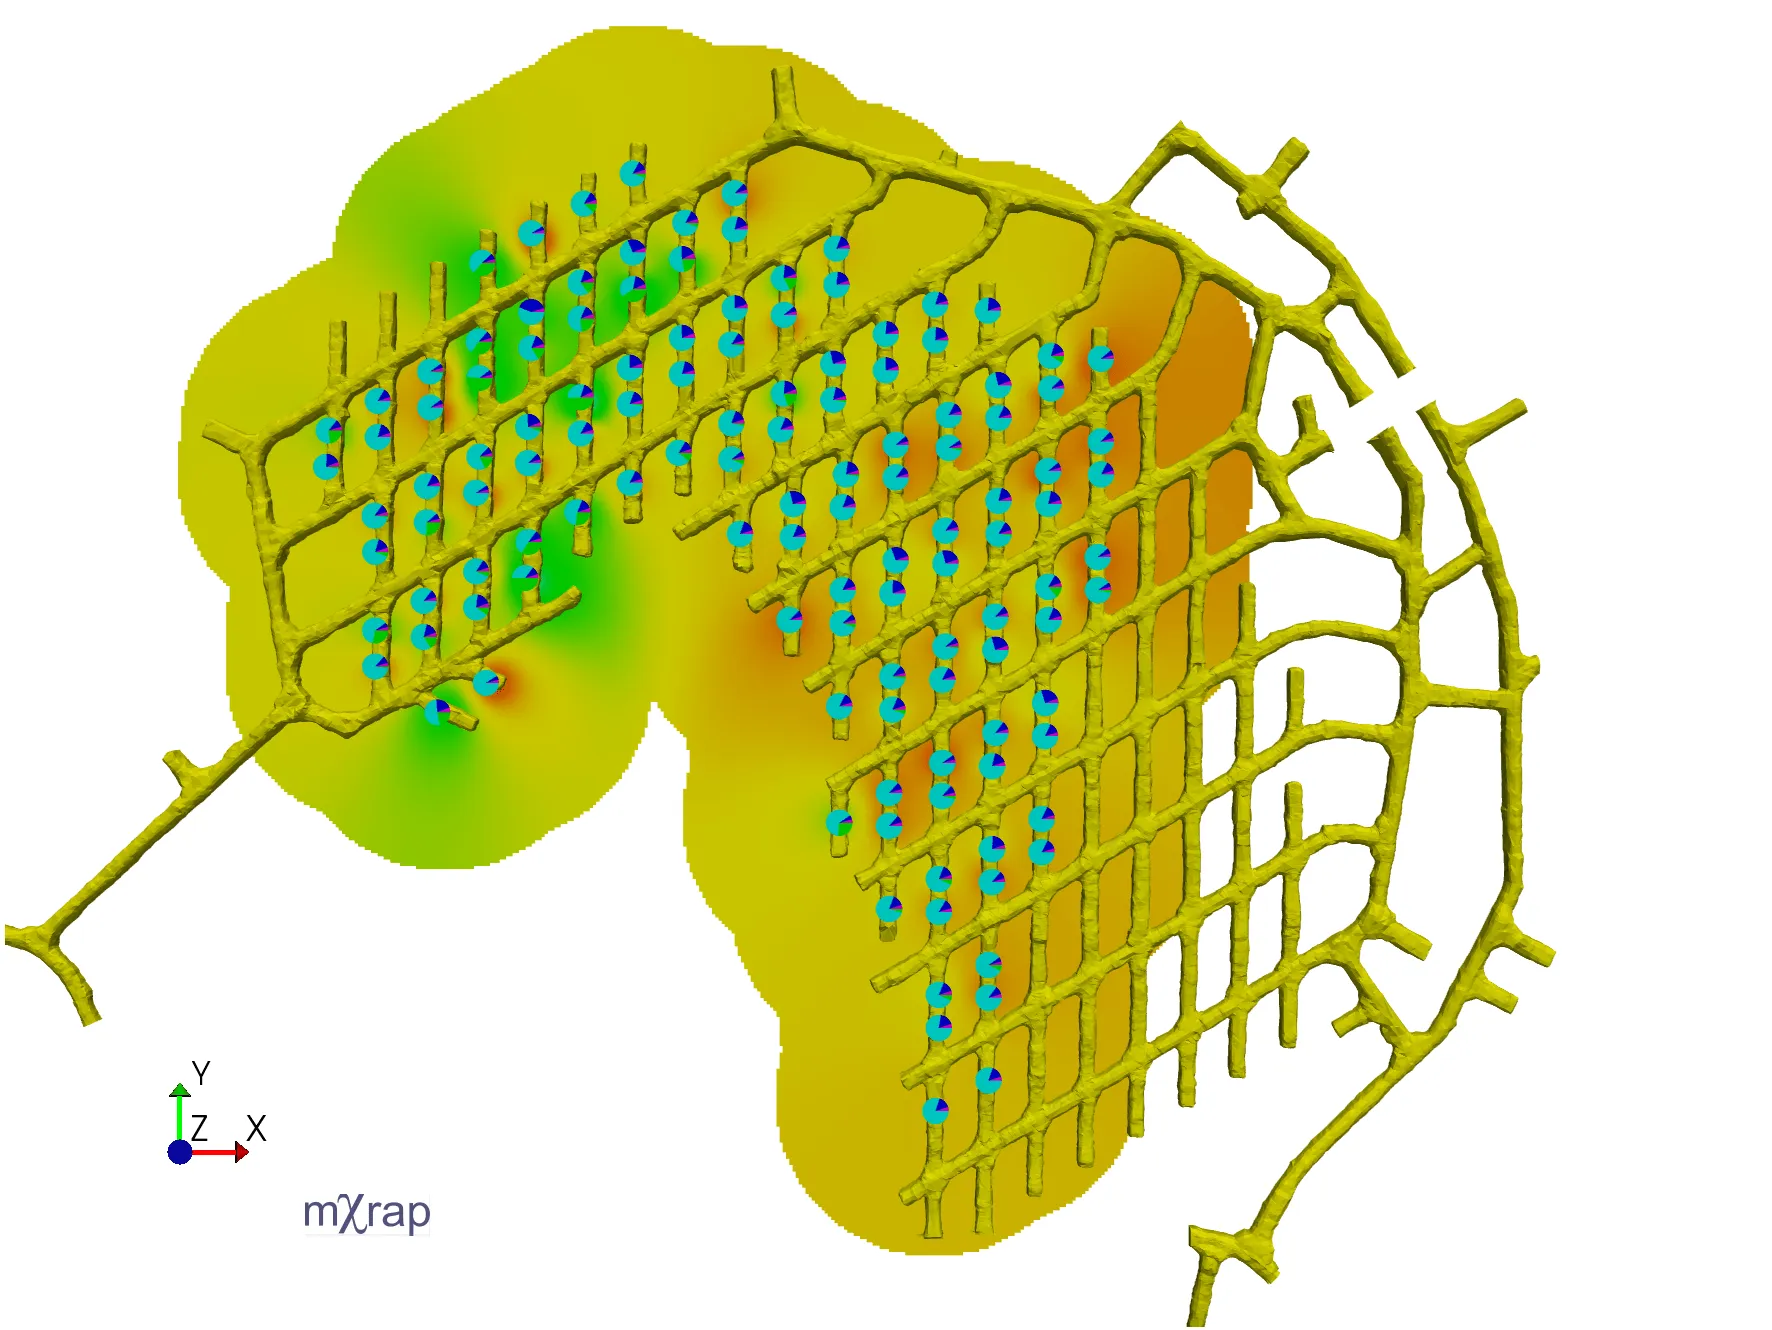
- Heat map
- Pie charts
- Mapping fragmentation to production columns