Basic viewer
Data Import
All Inspection apps have a One-Click data import into mXrap that imports all the data across all your webform apps in one-click.
You can reference how to import reports in Importing Reports
Data Visualisation and Filtering
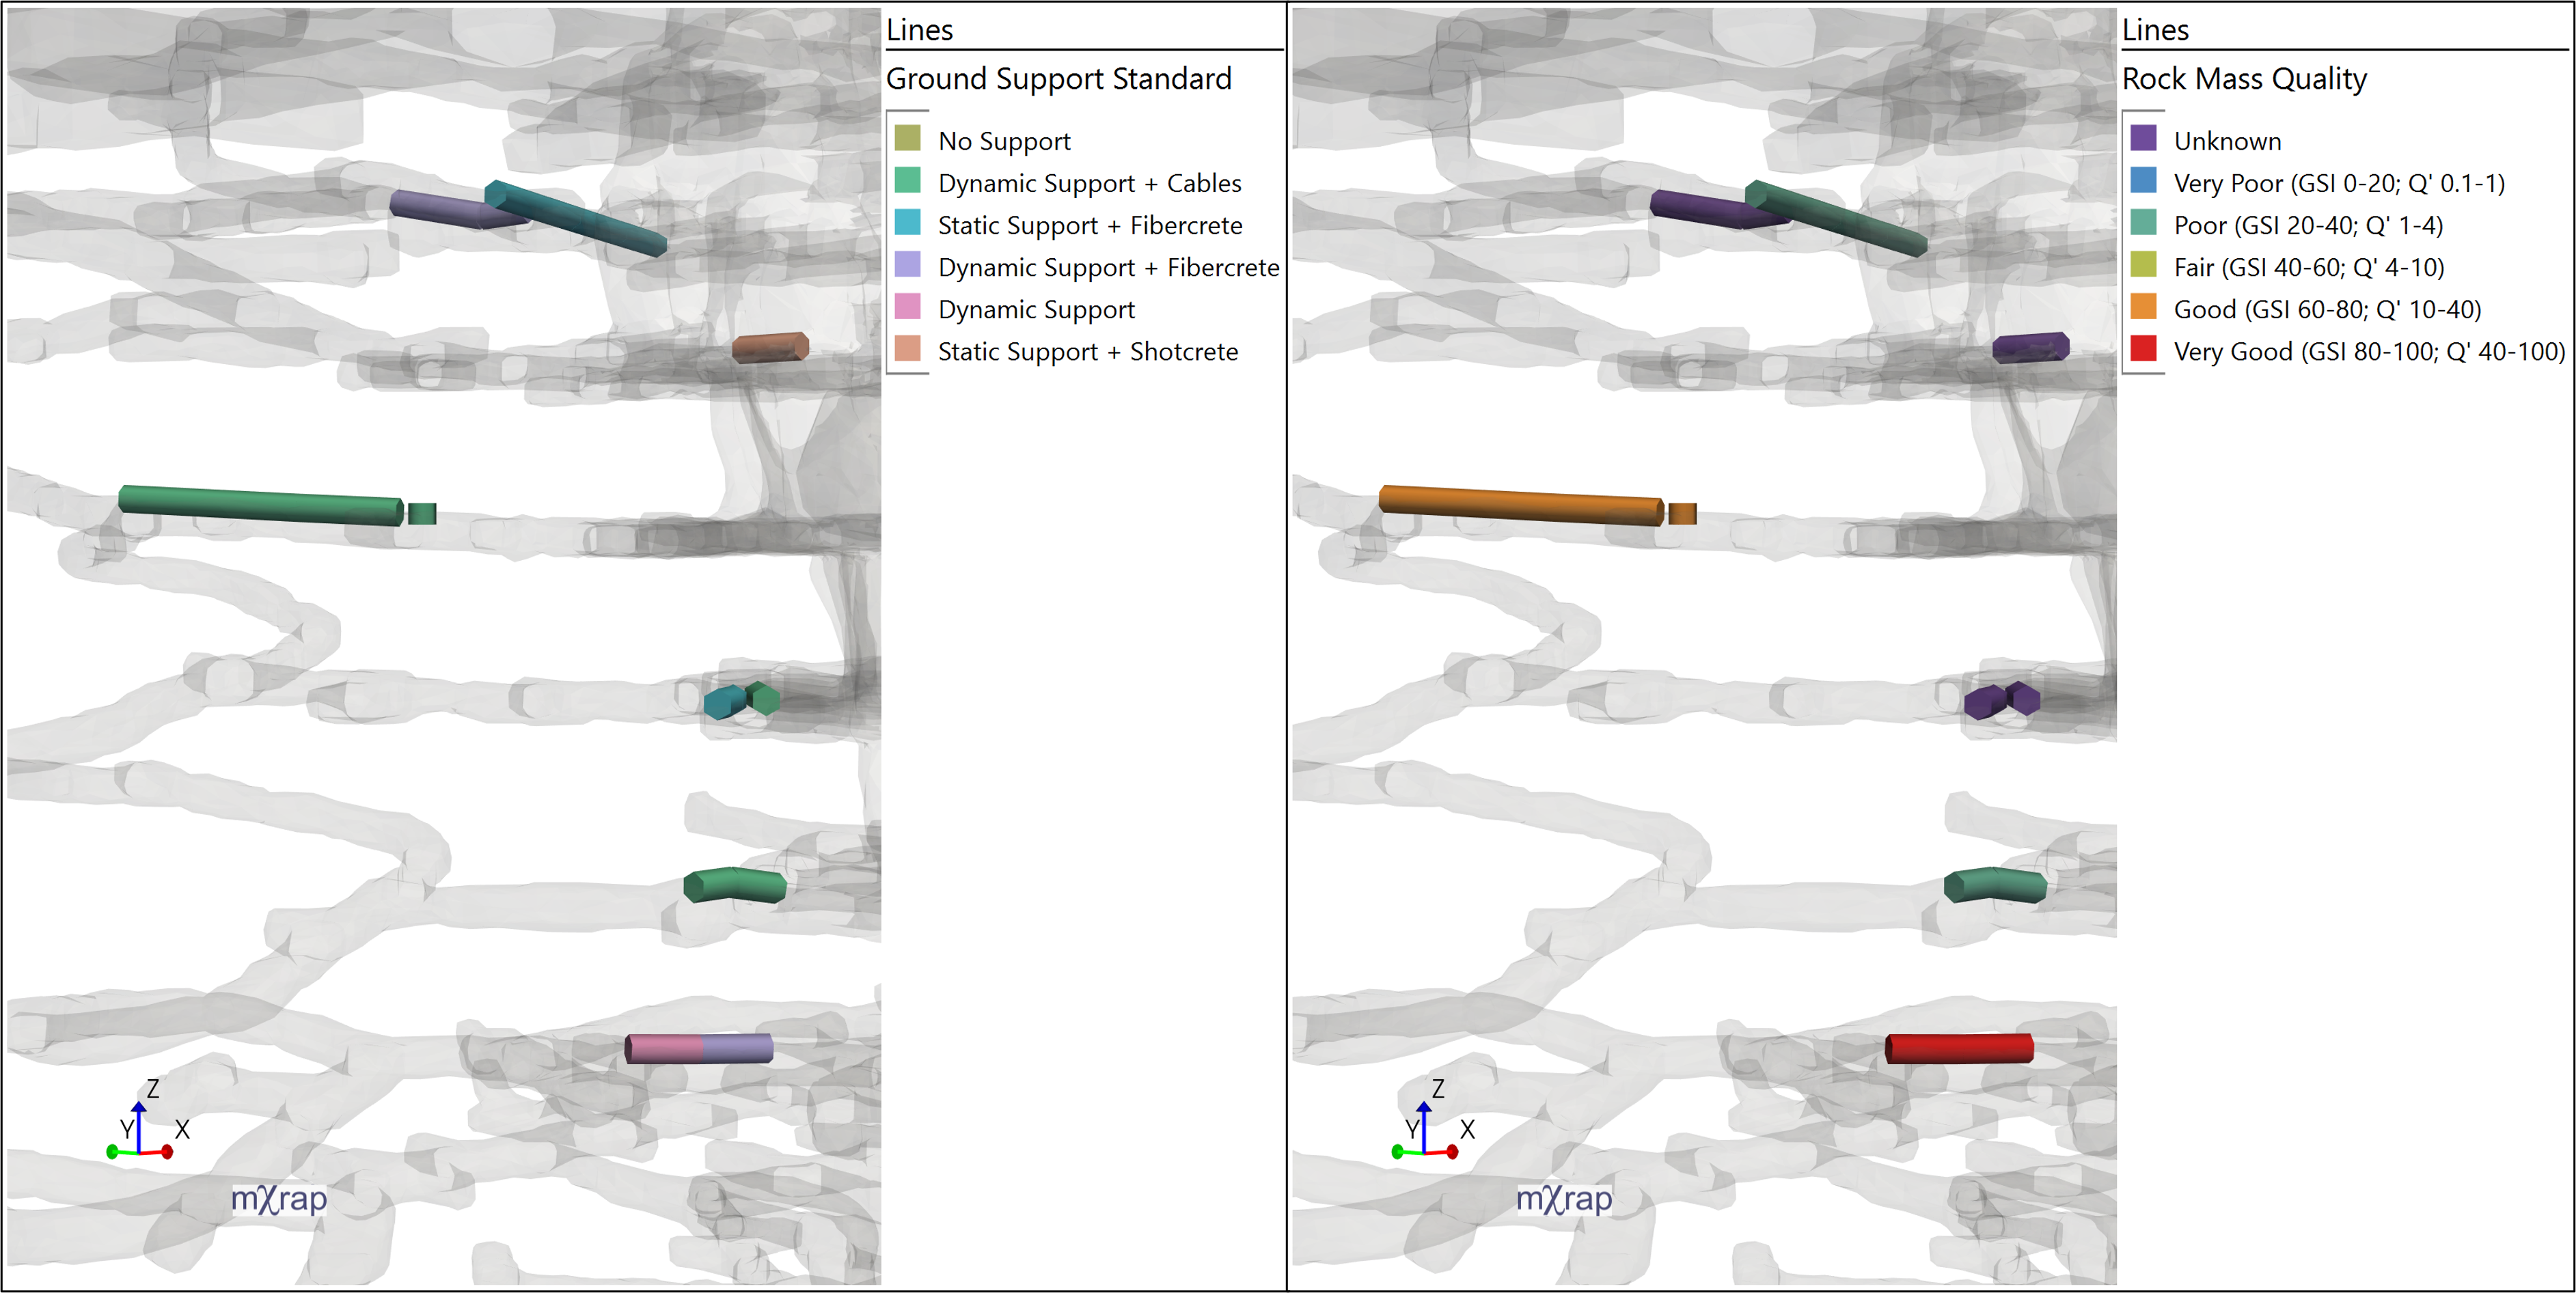
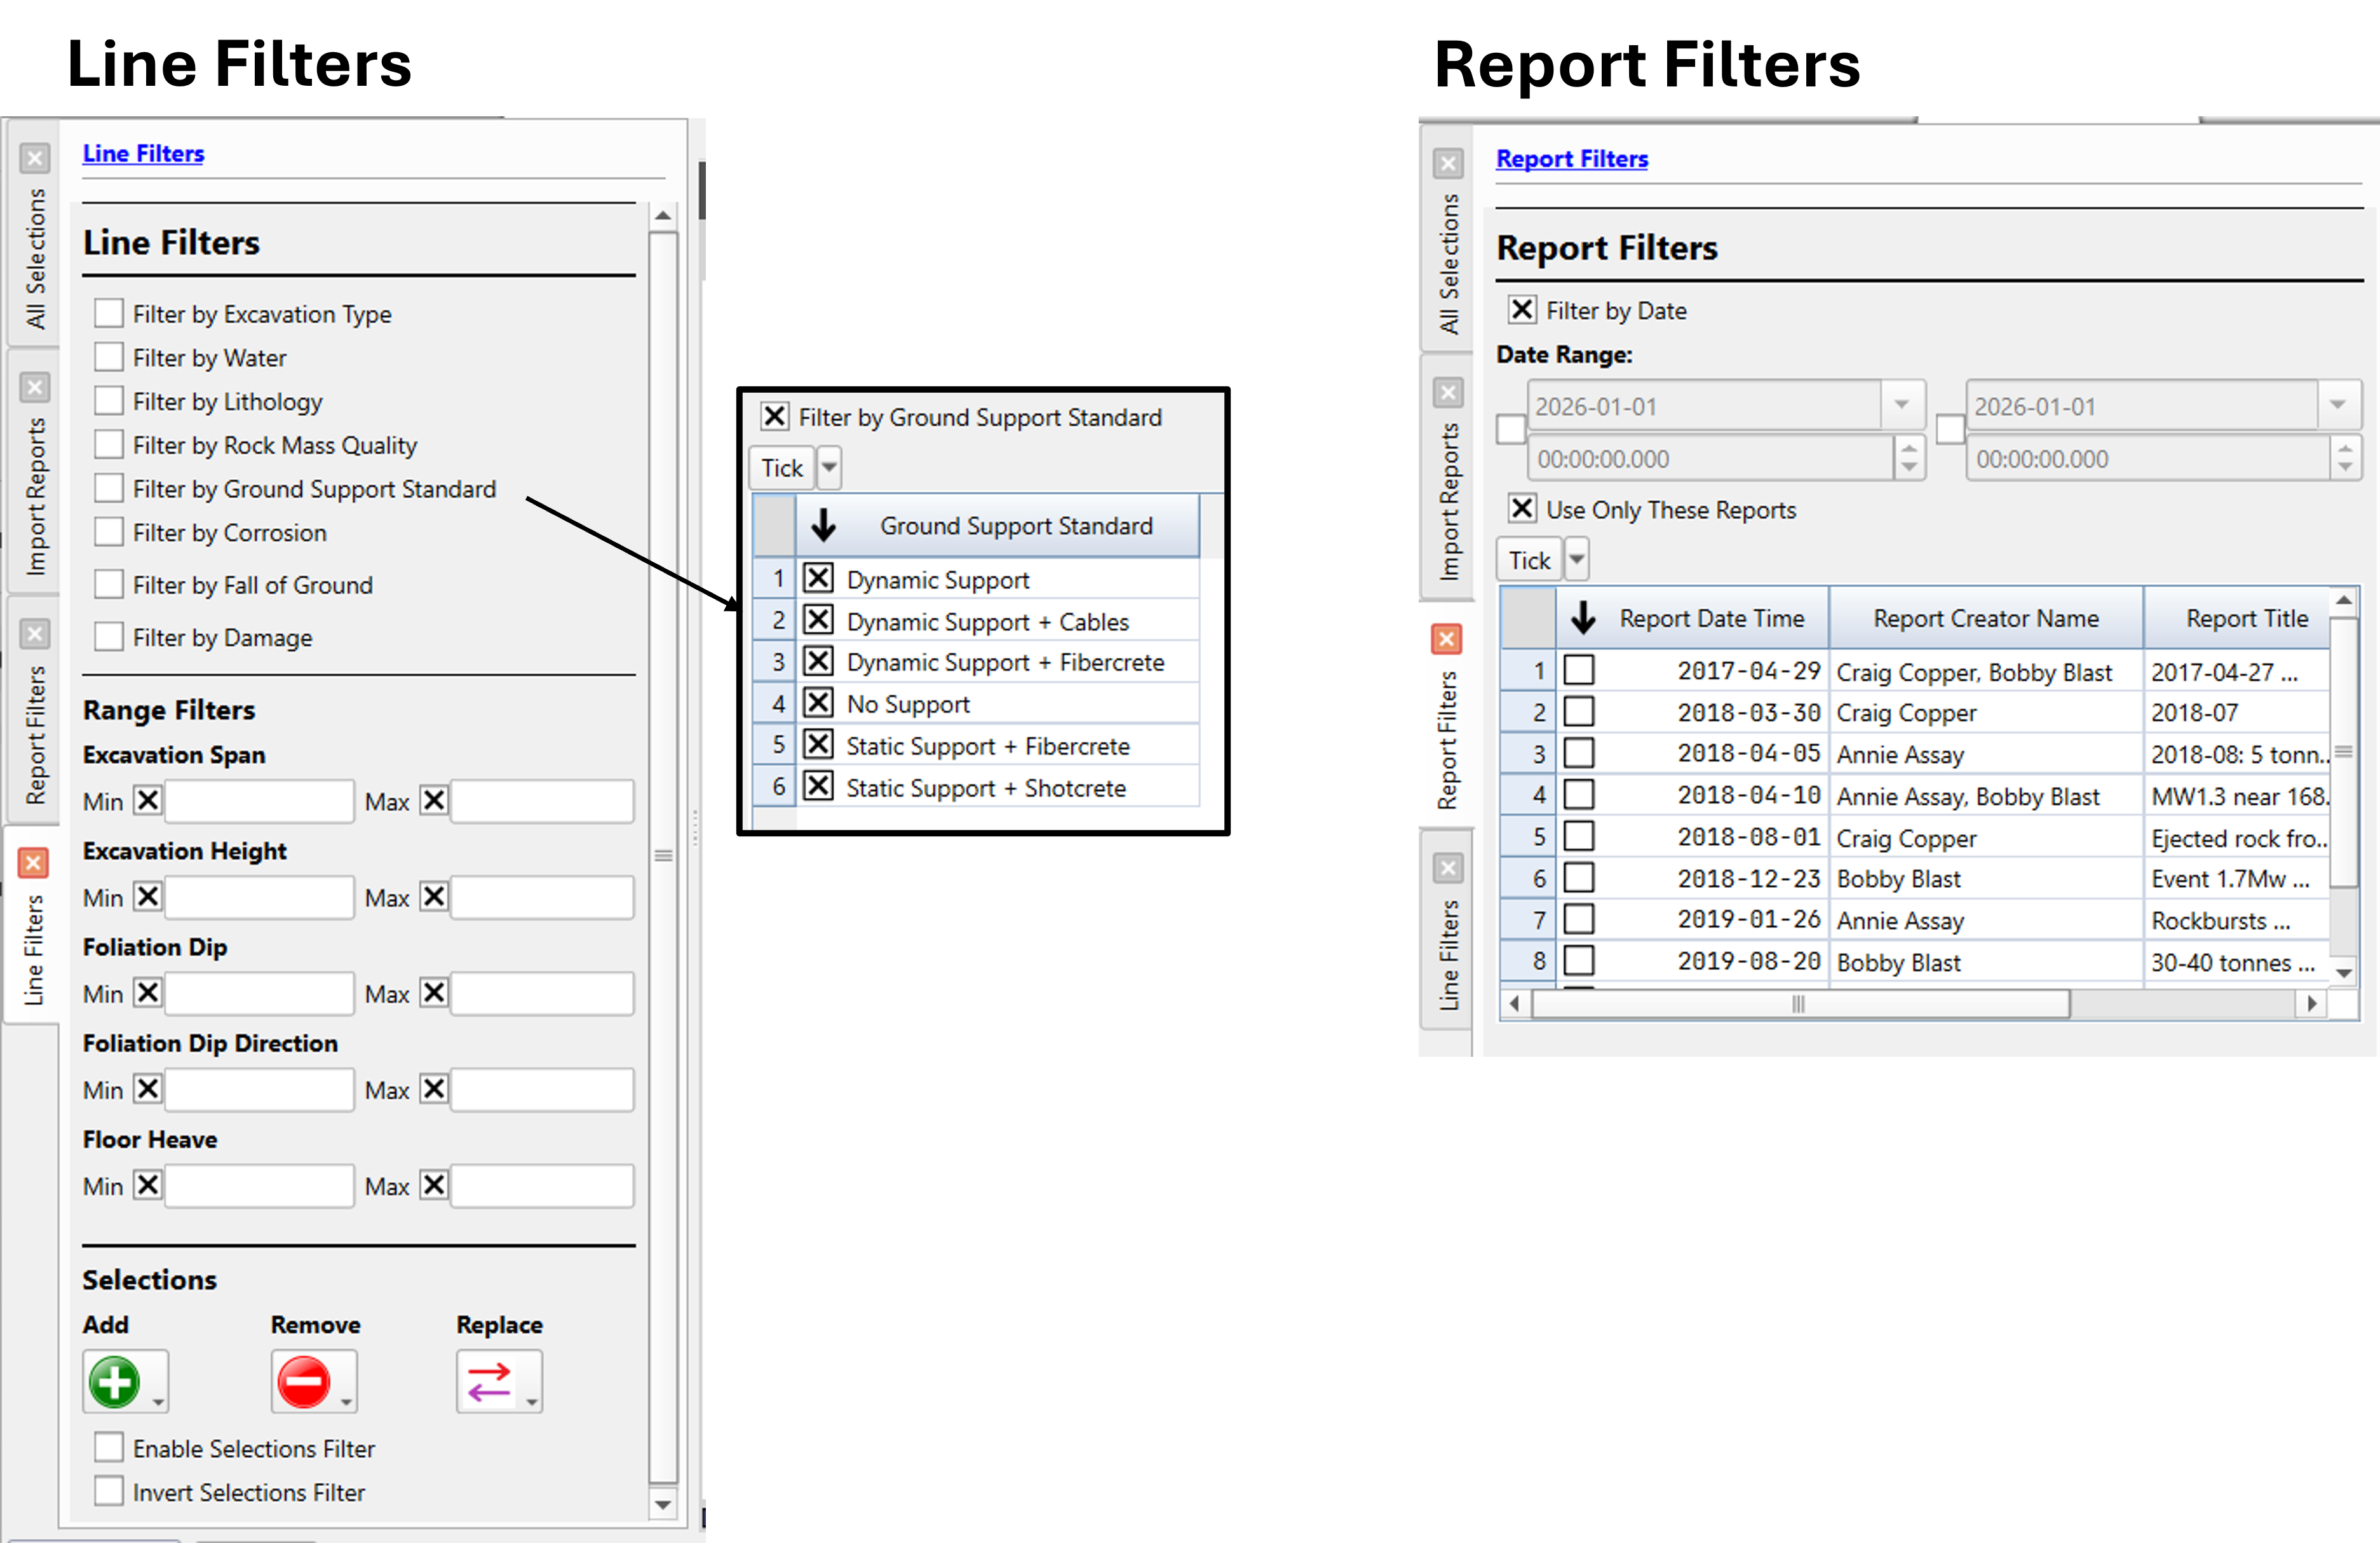
Points and lines can be visualised straight away in the 3D view, coloured by multiple data types and filtered by reports-data or lines-data. Volume filters can also be applied to these points and lines.
Data Analysis
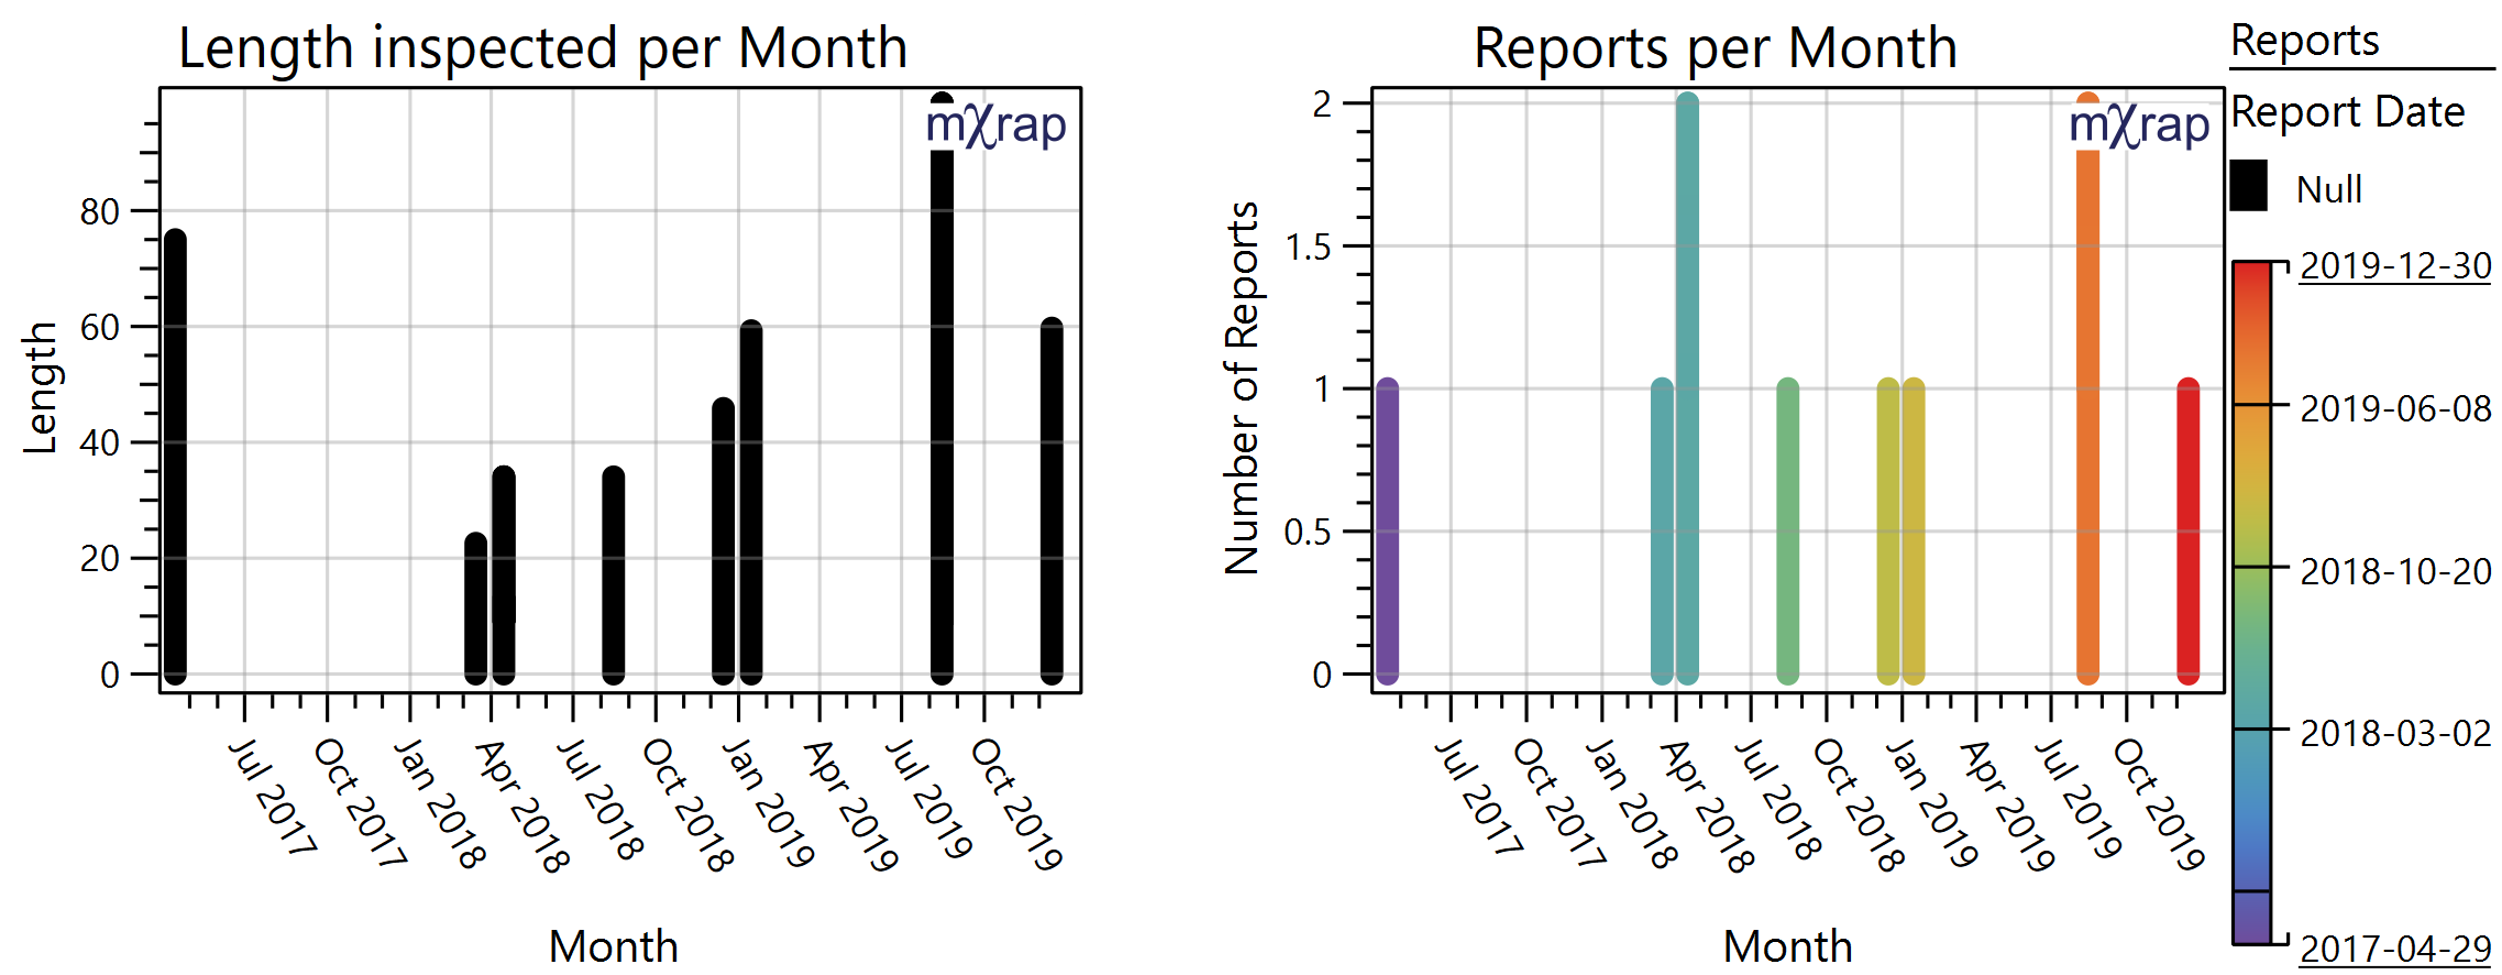
At the moment, there are only a few standard charts and tables in the app. If you think a chart would be useful for your mine site and others, please reach out to us.
Video
Walks through using the 3D view in the Desktop App side of Damage Inspections.