Rock Mass Quality
This app allows you to import both inputs about rock mass characterisation and classification for your geotechnical logging or mapping.
Supported Data Types
- Files imported must be in .csv format (auto-import with customized features OR manual csv import)
- Where there is no data available for the remaining columns leave blank.
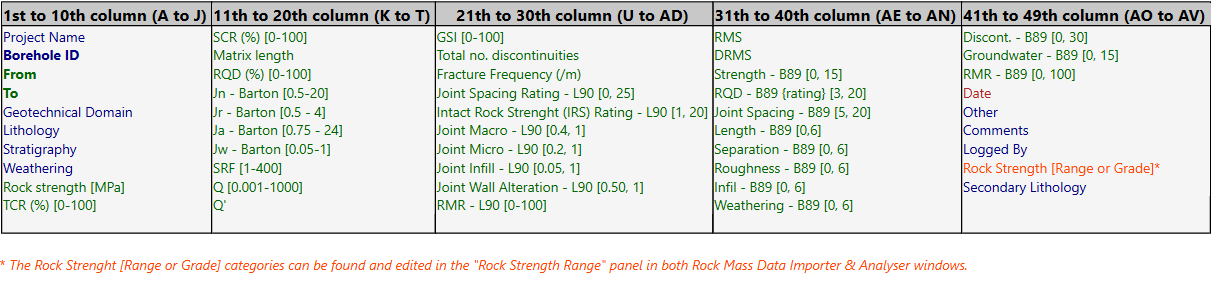
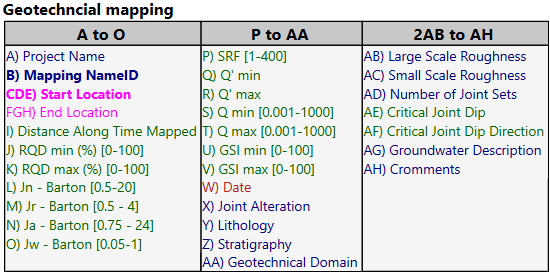
- Columns in the .csv file must be in the order specified in the sections below.
- Columns in the specified format, according to this color code:
- Number column (green)
- Text column (blue)
- Specific Text column (category) - See Table below (orange)
- Date column : yyyy-MM-dd (red)
- Point columns : X Y Z (3 number columns) (pink)
Key Features
Automatic updates from on-site databases or manual csv import, and also from webform for geotech mapping (Q mapping)
-
Automatic import: Please refer to the template to know which columns are needed. Email us at support for site-specific setup.
-
Here is a video on how to manually import geotech logs
- You can also import Q mapping data from geotech mapping webform:
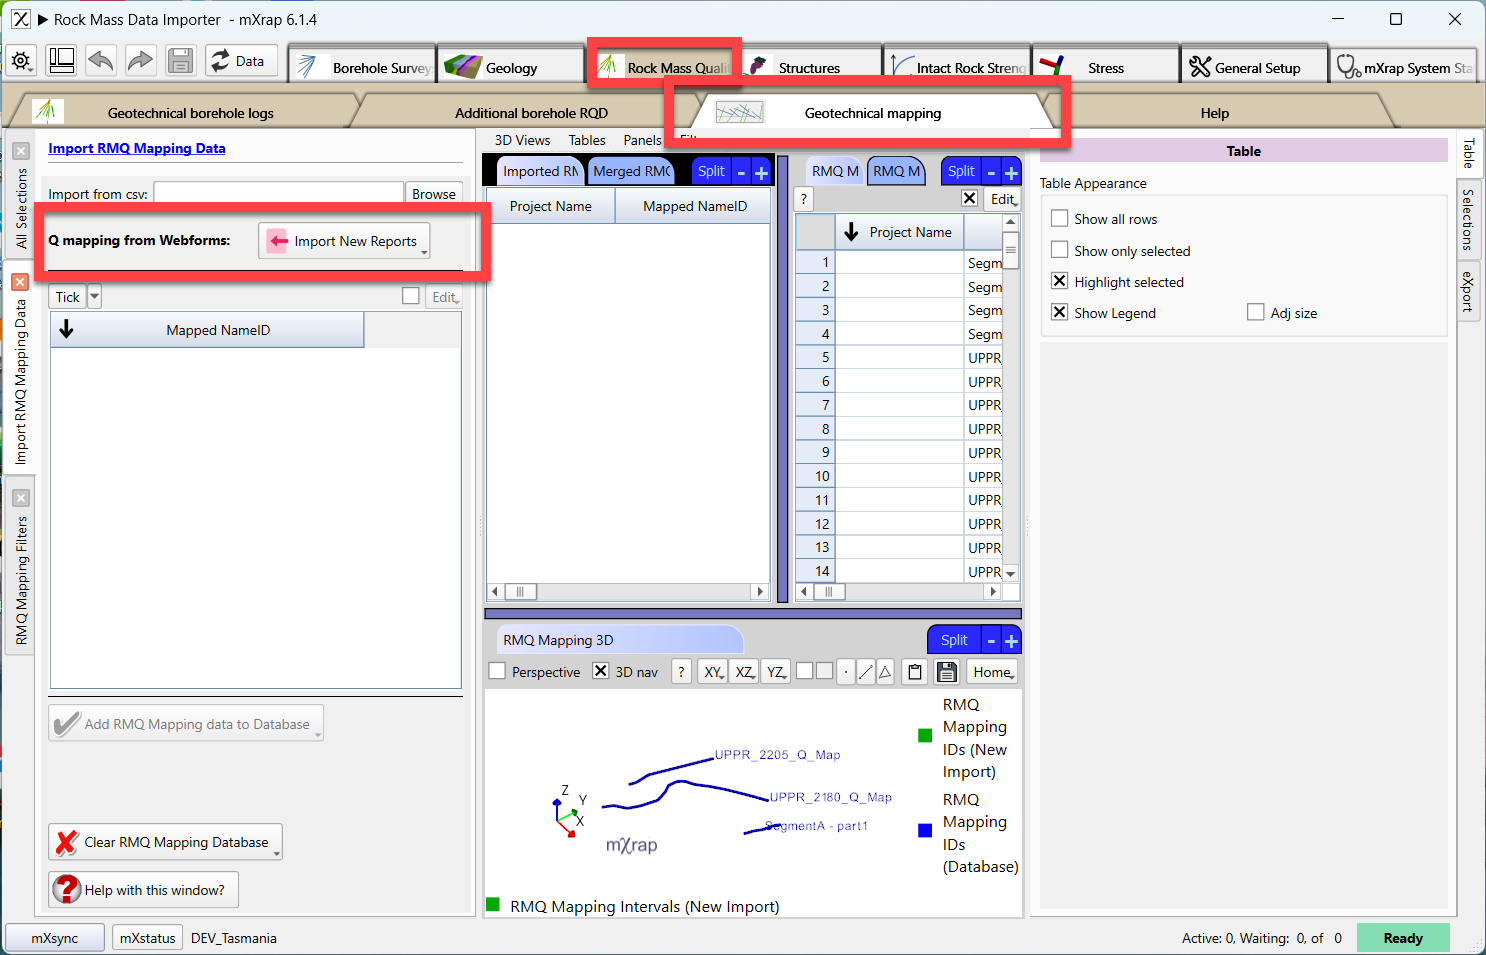
If you are interested into this webform, please email us.
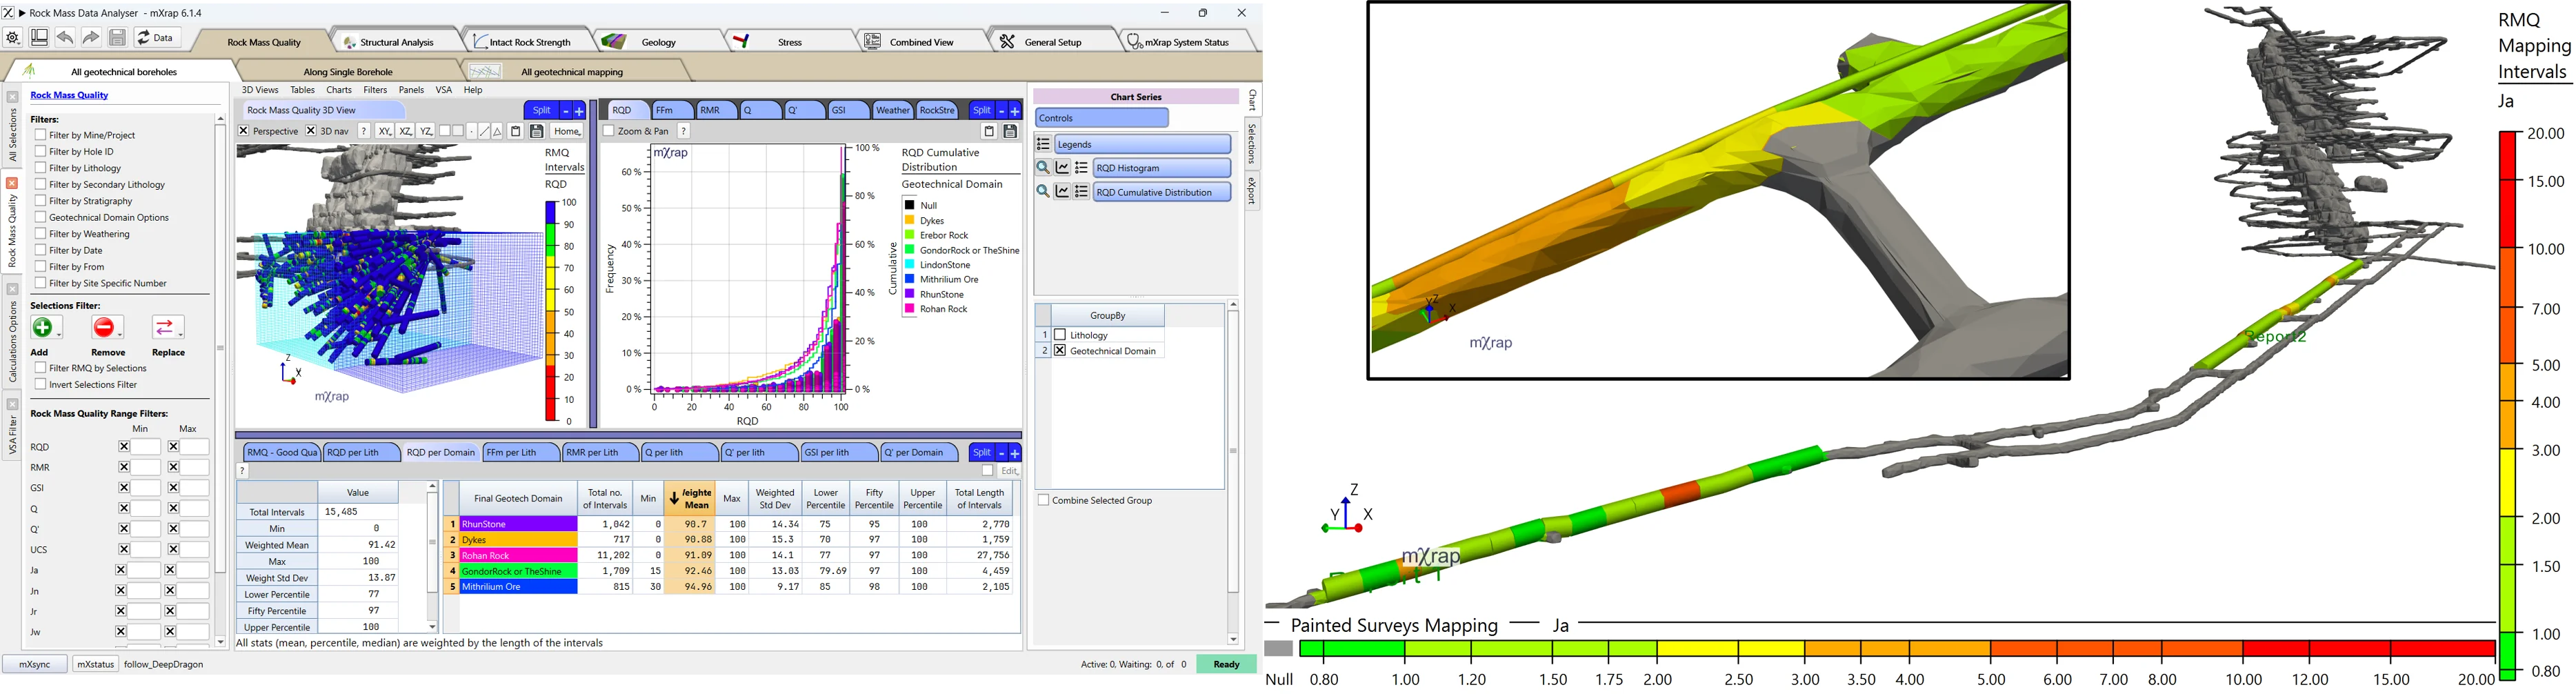
Quick statistical comparison between groups (lithologies or geotechnical domains)
Usage of imported values or calculated from raw input data (UCS lab tests, fracture frequency, etc.) or input parameters (ex. Jn, Ja, Jr, SRF, Jw)
Documentation in progress
Use RQD from a second source (i.e. from geological-RQD to fill the blank geotechnical-RQD logs)
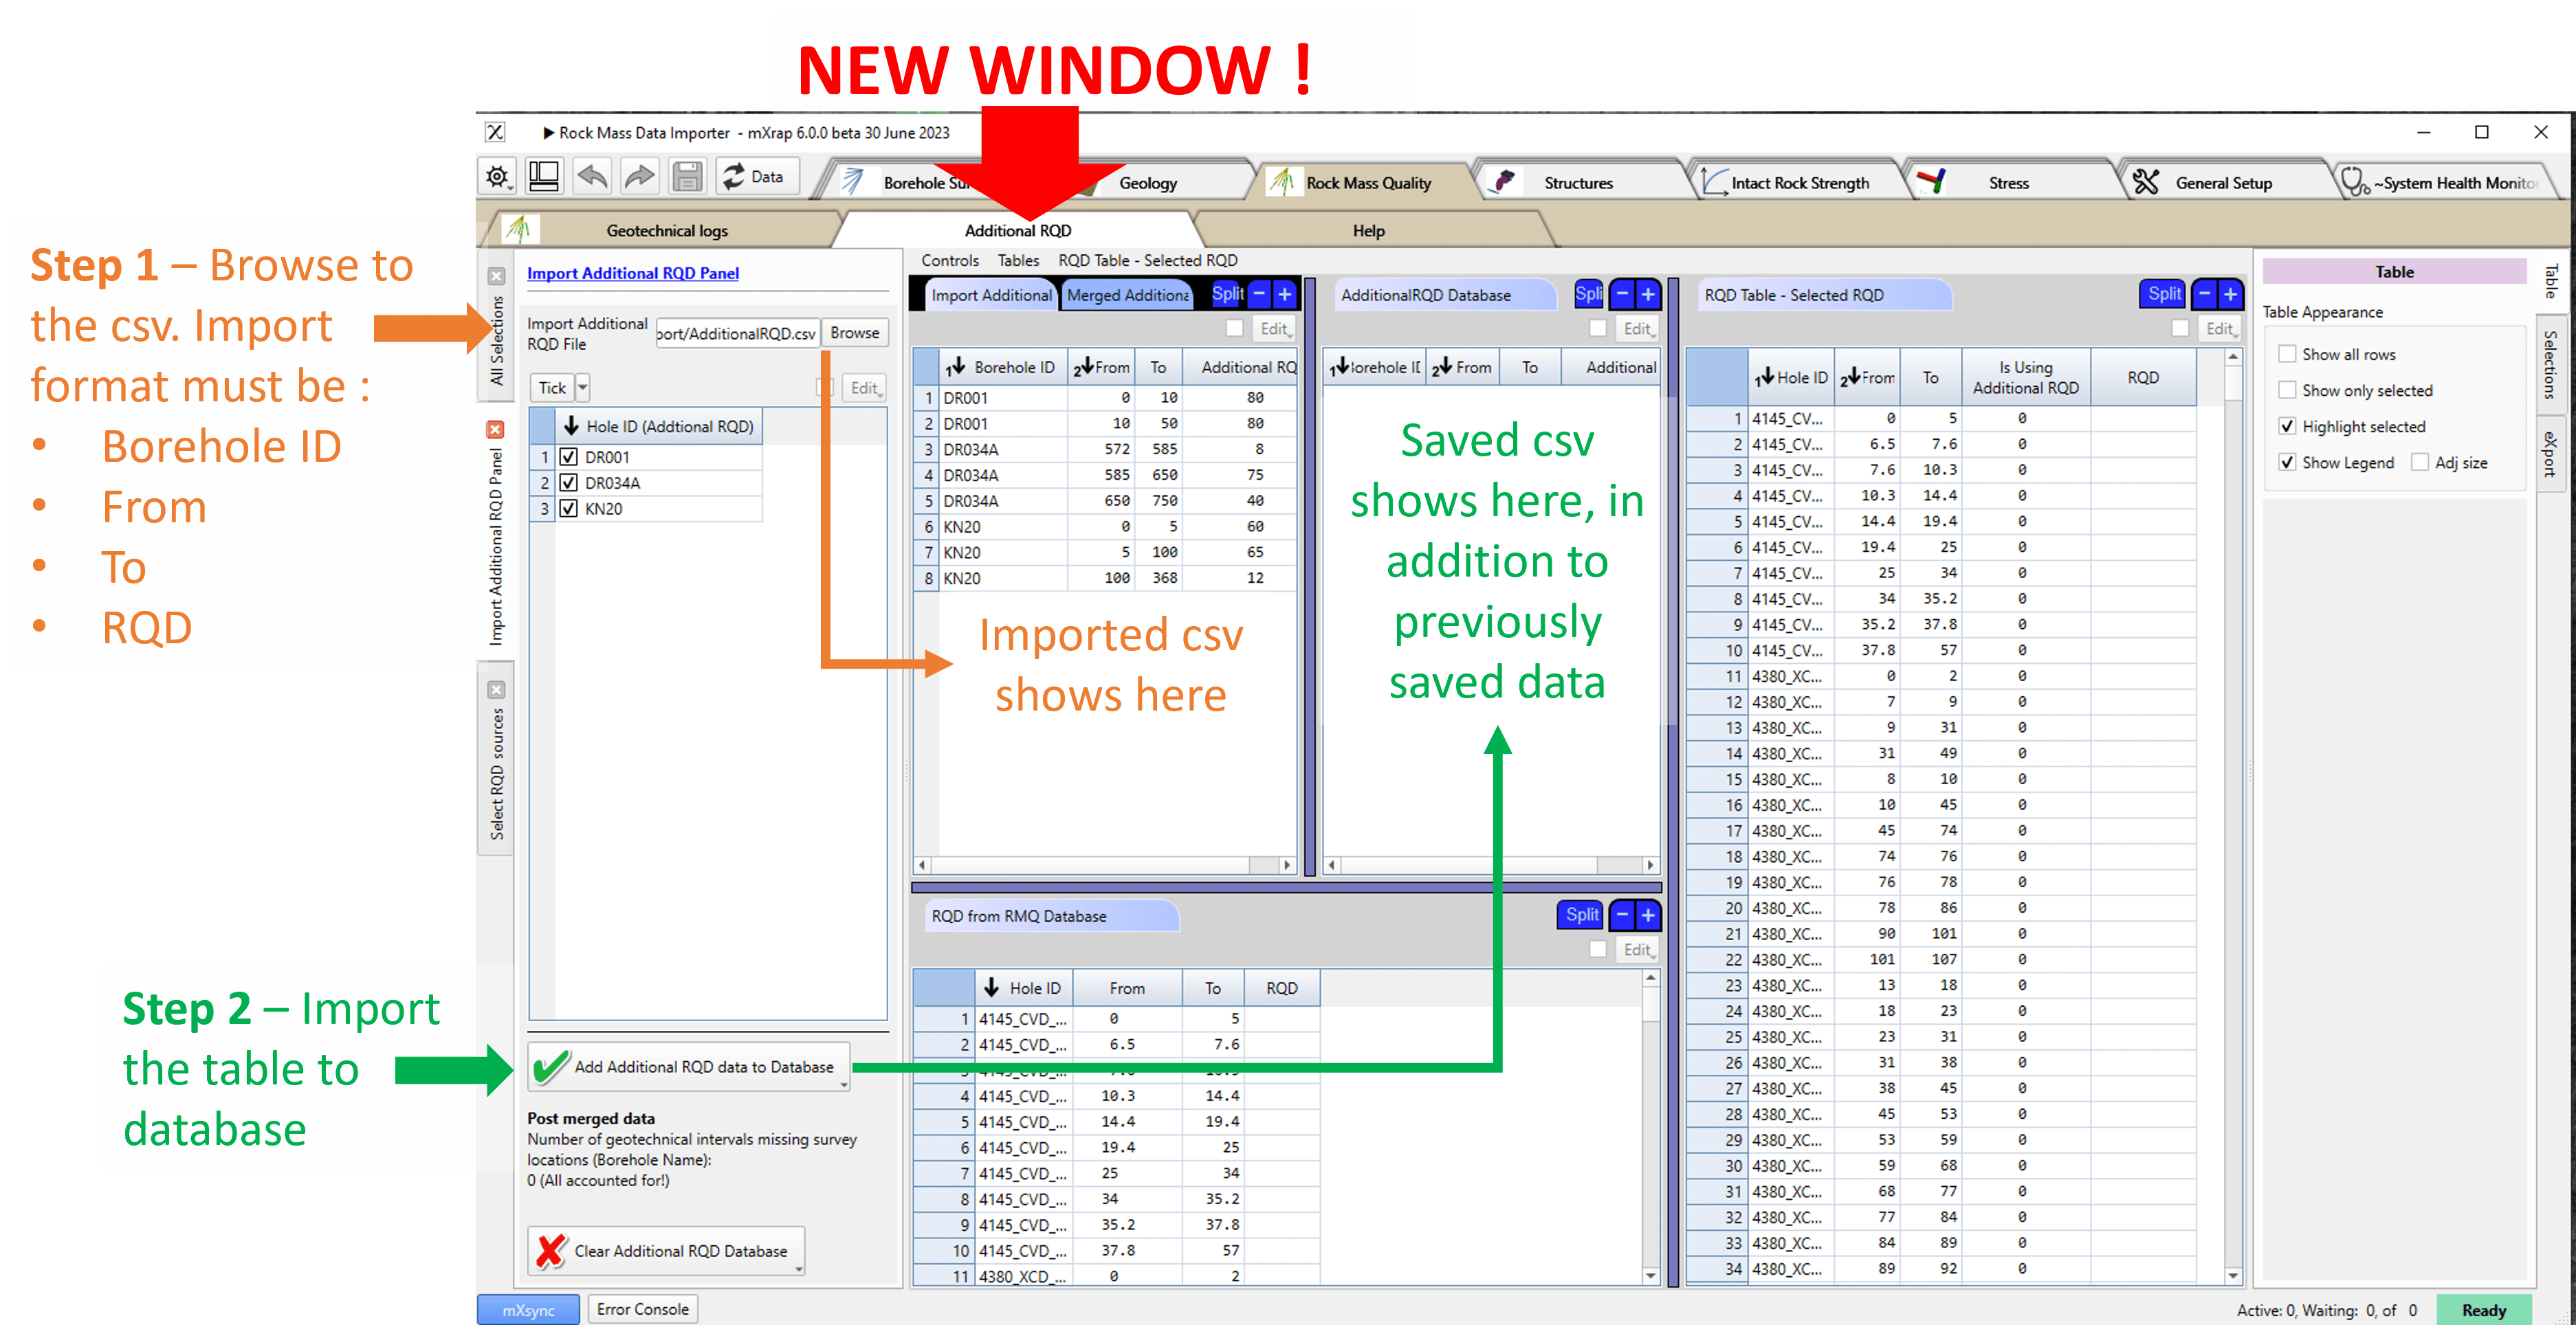
Allow you to import RQD values with intervals other than the one defined with your rock mass quality data csv by :
Step 1 and 2
Import the csv containing the RQD data along the borehole, in the following column order: Borehole ID, From, To, RQD value (see Figure) by first browse to your file and second, press ‘import'.
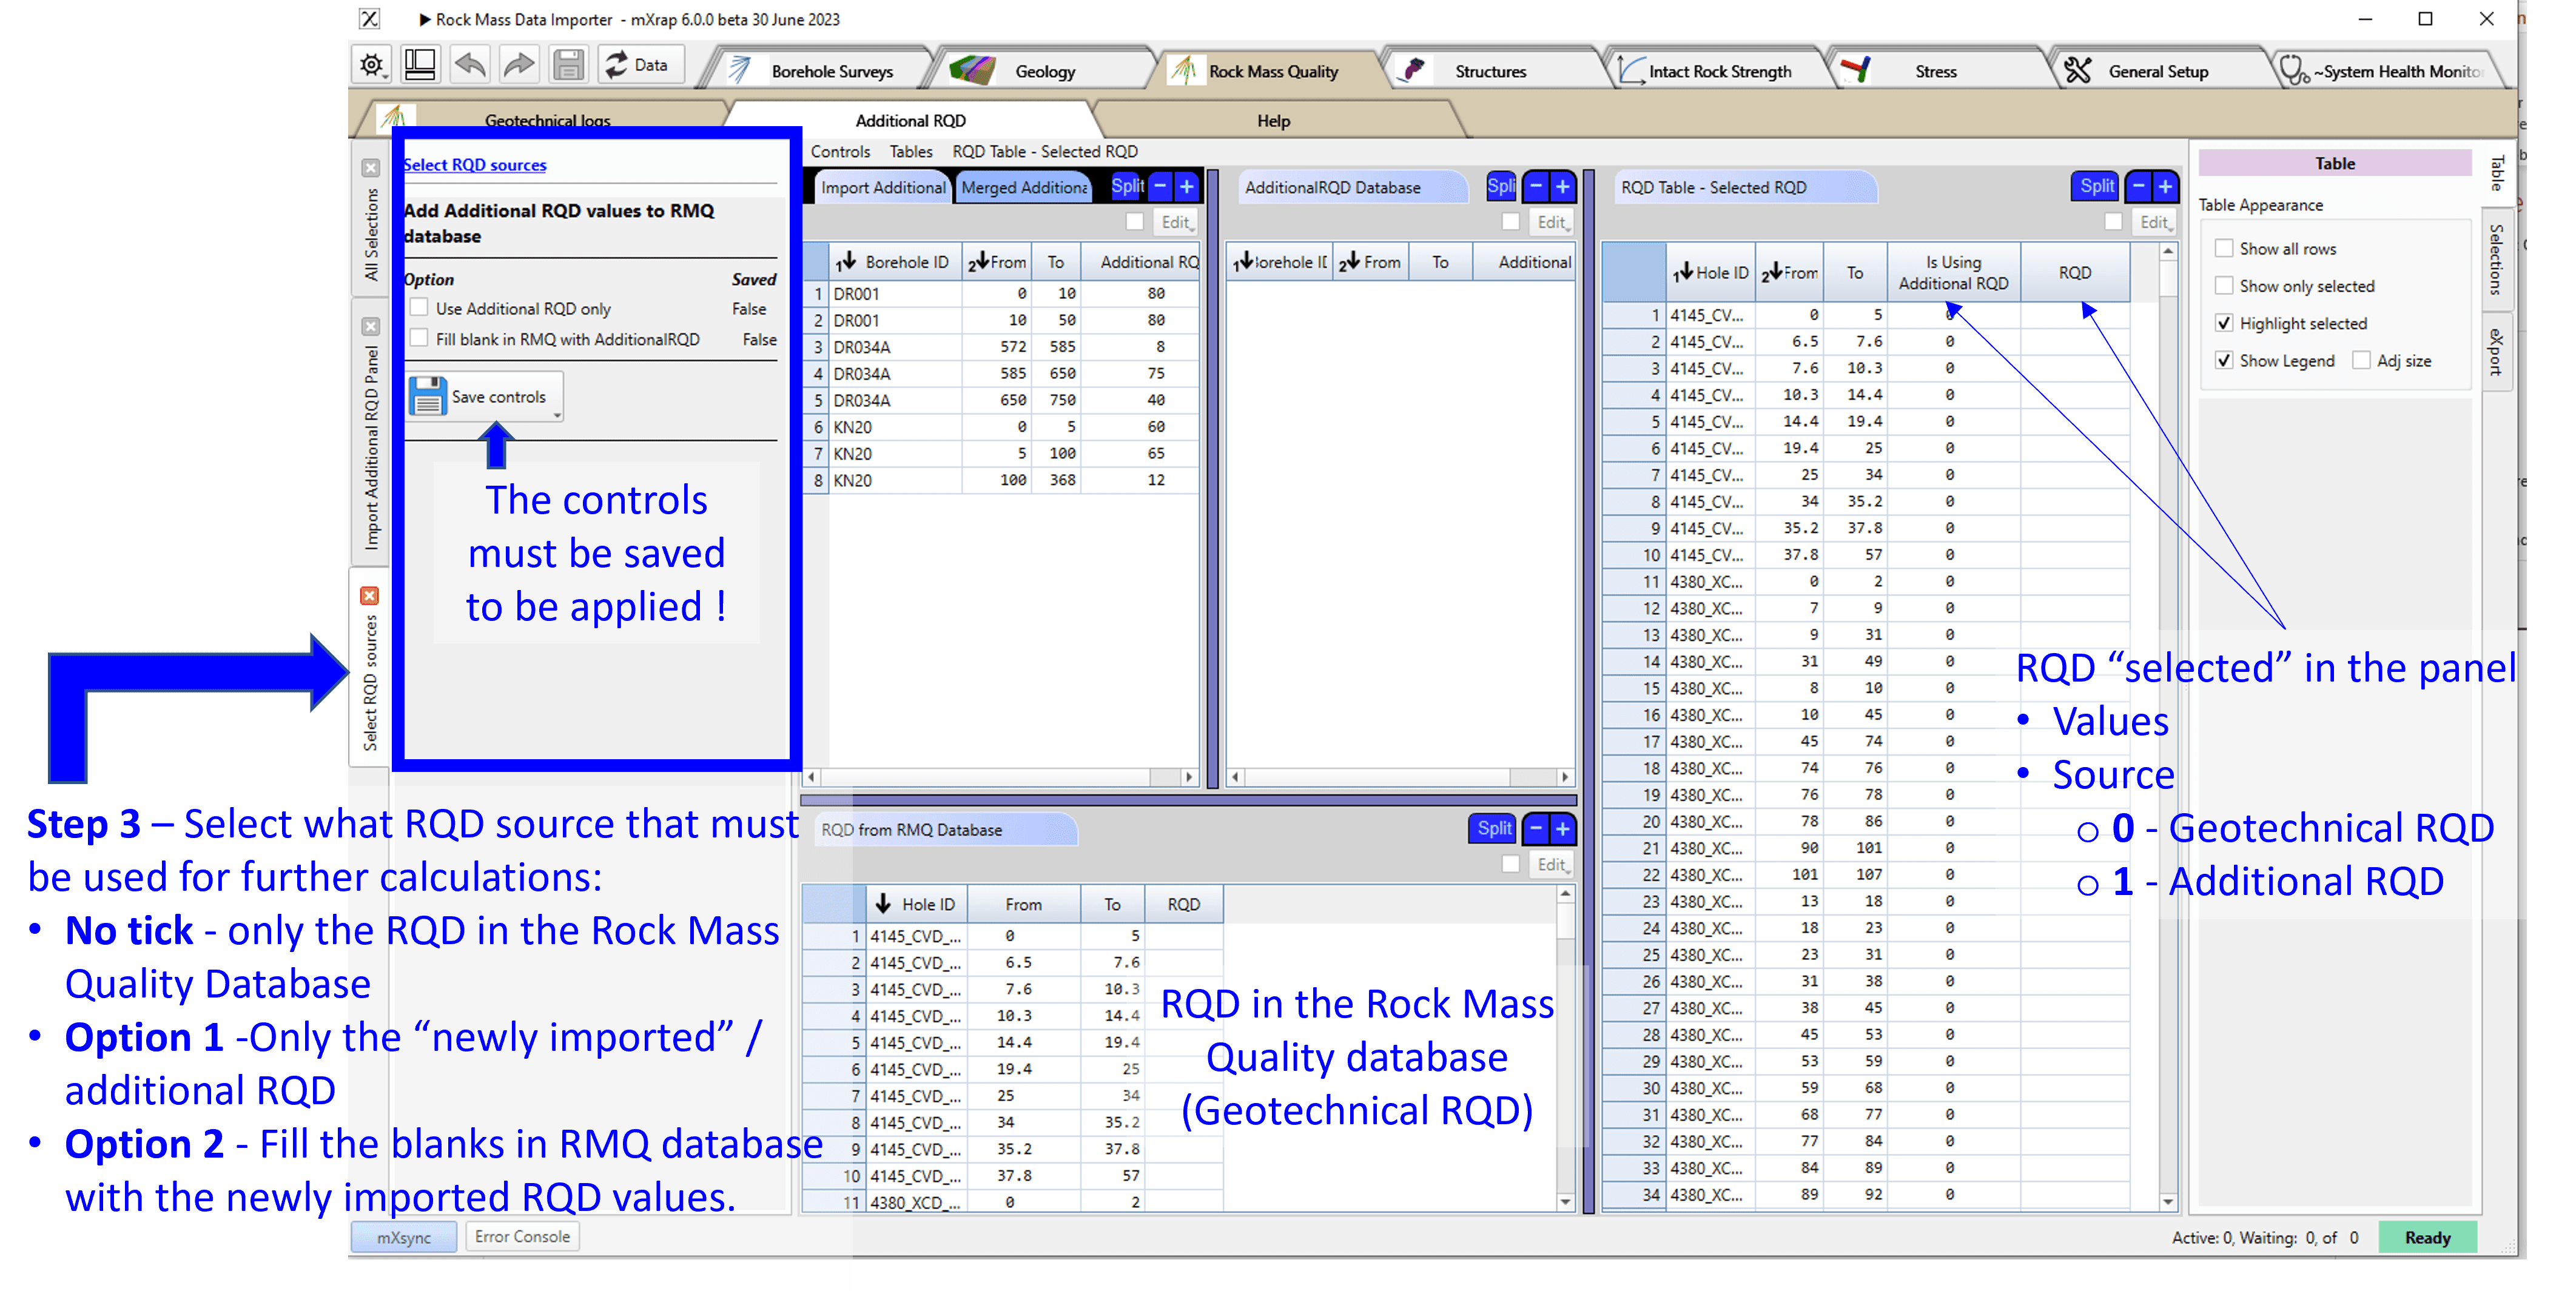
Step 3
The newly imported RQD values can be seen alongside the RQD values from your rock mass quality data imported, if it exists. You can choose which RQD values to use for the further analysis (Tables, Charts & 3D View) in 'Select RQD sources' (see Figure below). The same panel can be found in both the Rock Mass Data Importer app and the Rock Mass Data Analyser app.
Down-the-hole analysis and core photo viewer
Paint on excavation geotechnical data
Here is a video for mapping data:
Here is a video for logging data:
FAQ
What happens if I import the same borehole twice?
For automatic import, the duplicates will remain - you need to ensure that your database is clean. For manual csv import, if you try to import a borehole that already exists, the new data will overwrite the old one for the whole borehole (not just the segments you modified).
Can I edit the RMQ database in mXrap?
If you are using auto-import, no. If you used manual import, yes, in the Importer app.
Further Resources
Barton, N., Lien, R., Lunde, J. 1974. Engineering Classification of Rock Masses for the Design of Tunnel Support. Rock Mechanics 6(4): 189-236.
Barton, N. 2002. Some new Q-value correlations to assist in site characterisation and tunnel design. International Journal of Rock Mechanics and Mining Sciences 39: 185-188.
Laubscher, D.H. 1990. A Geomechanics Classification System for the Rating of Rock Mass in Mine Design. Journal of the South African institute of Mining and Metallurgy 90(10): 257-473.
Jakubec, J. and Laubscher, D.H. 2000. The MRMR rock mass rating classification system in mining
practice, MassMin 2000, Brisbane, Queensland, AusIMM. 413-421.
Bieniawski, Z.T. 1973. Engineering classification of jointed rock masses. Transactions of the South African Institution of Civil Engineers 15: 335-343.
Bieniawski, Z.T. 1989.Engineering Rock Mass Classifications. John Wiley and Sons Inc. Canada. 51-105.
Deere, D. U. 1967. Engineering classification and index properties for intact rock, Report No. AFWL-T-65-116. Air Force Weapons Laboratory, Kirtland Air Force Base, New Mexico.