Level setup
This window is used to create a new level or to manually update an existing level. Manual updates may be required in some cases, or you may choose to manually update if you wish to adjust some properties of the level (e.g. the clipping range). Updating a level and creating a level follow the same sequential process, with just one additional step for creating a new level: choosing a level name. The control panel on the left of the screen will update as you move through each step of the process.
Creating a new level
To start with, we will click on the Create a new level button.
Setting the level name
Next we will enter a name for the level, and click the Continue button.

Selecting level surveys
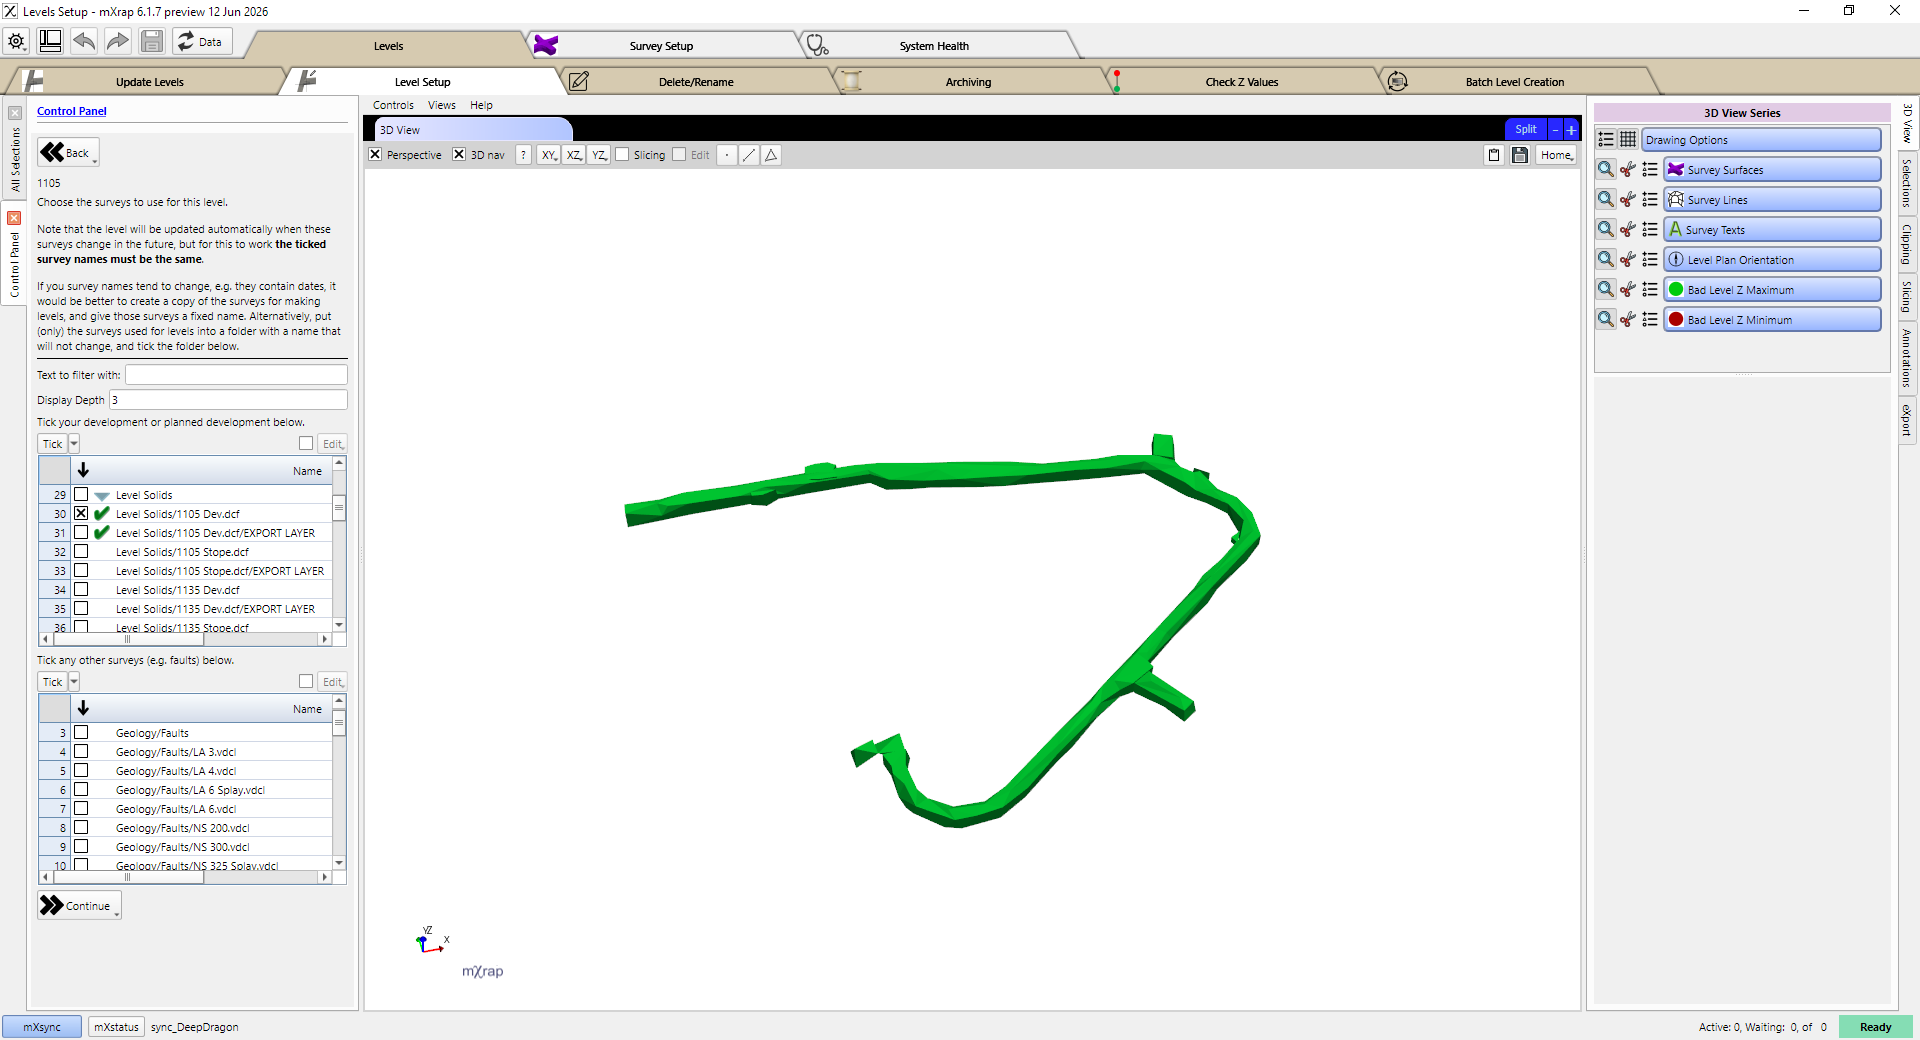
Now we must select the surveys to use for this level. The system will remember which survey names we ticked, and it will look for those exact survey names when trying to automatically update levels in the future. For this reason, it is ideal if we can tick names which will not change. If you tick a folder then all surveys in that folder, and subfolders, will be used in the level.
The system will also check if the contents of the used (not limited to ticked) surveys have changed, in order to identify when a level requires updates. This works best if your levels are divided into individual surveys as shown in the image below. While it is possible to use a single survey containing all of your development, and then use clipping to create a particular level, whenever this single survey is changed it will trigger an update for all of the levels created from it.
There are two tables for ticking surveys: the top is for development, and the bottom is for other surveys (e.g. faults). The surveys used in the top table will also be used to create the Z-value map for this level, which is used to calculate Z-values for the lines and points that you create in the inspections system.
Setting clipping
In the next step you can choose to apply clipping to the level. The clipping settings will be remembered, and the same clipping settings will be restored when this level is updated in the future. Note that the clipping option is limited to axis-aligned bounding box (AABB) clipping; clipping volumes that use volume set definitions will not work. If you use the dynamic clipping options at the top of the panel, ensure that you also tick the "#Dynamic Clipping" volume in the clipping volumes table.
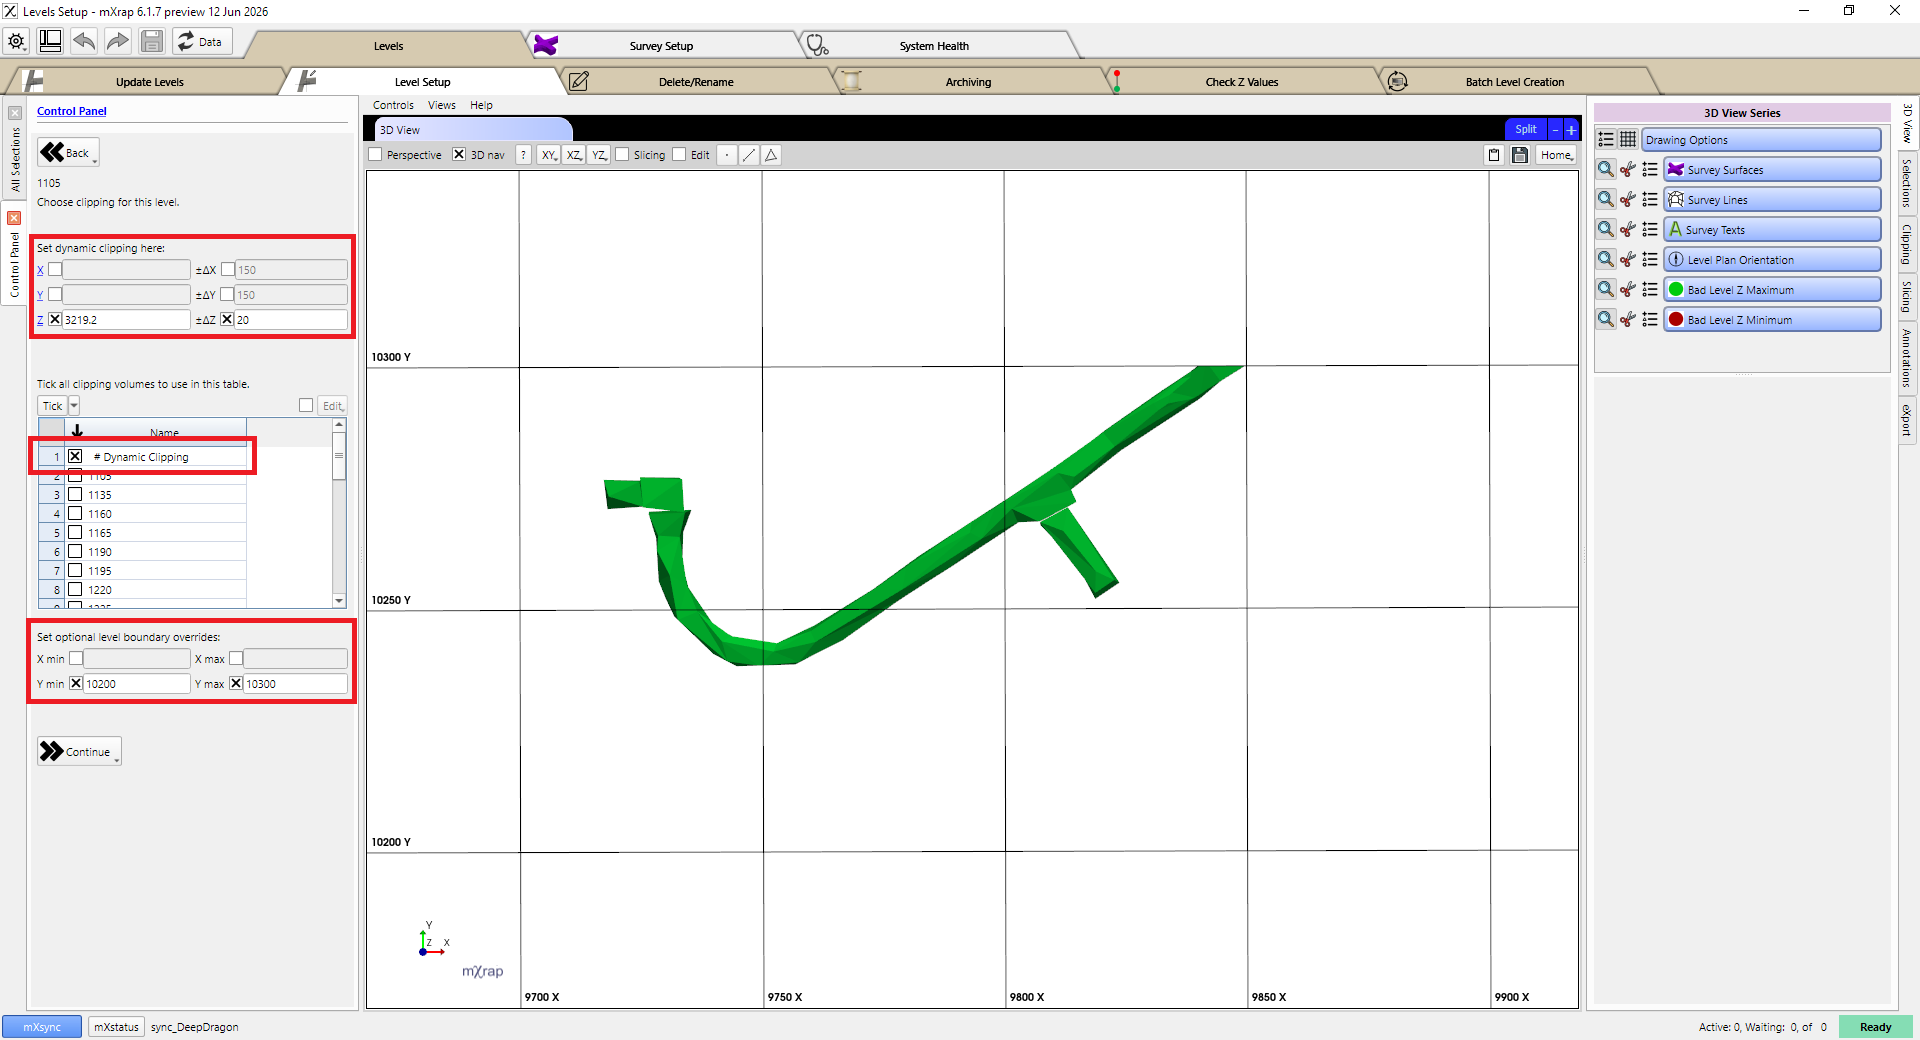
At this stage you might also start to see points appear in the Bad Level Z Maximum and Bad Level Z Minimum series. These points indicate areas where there might be overlapping development surveys.
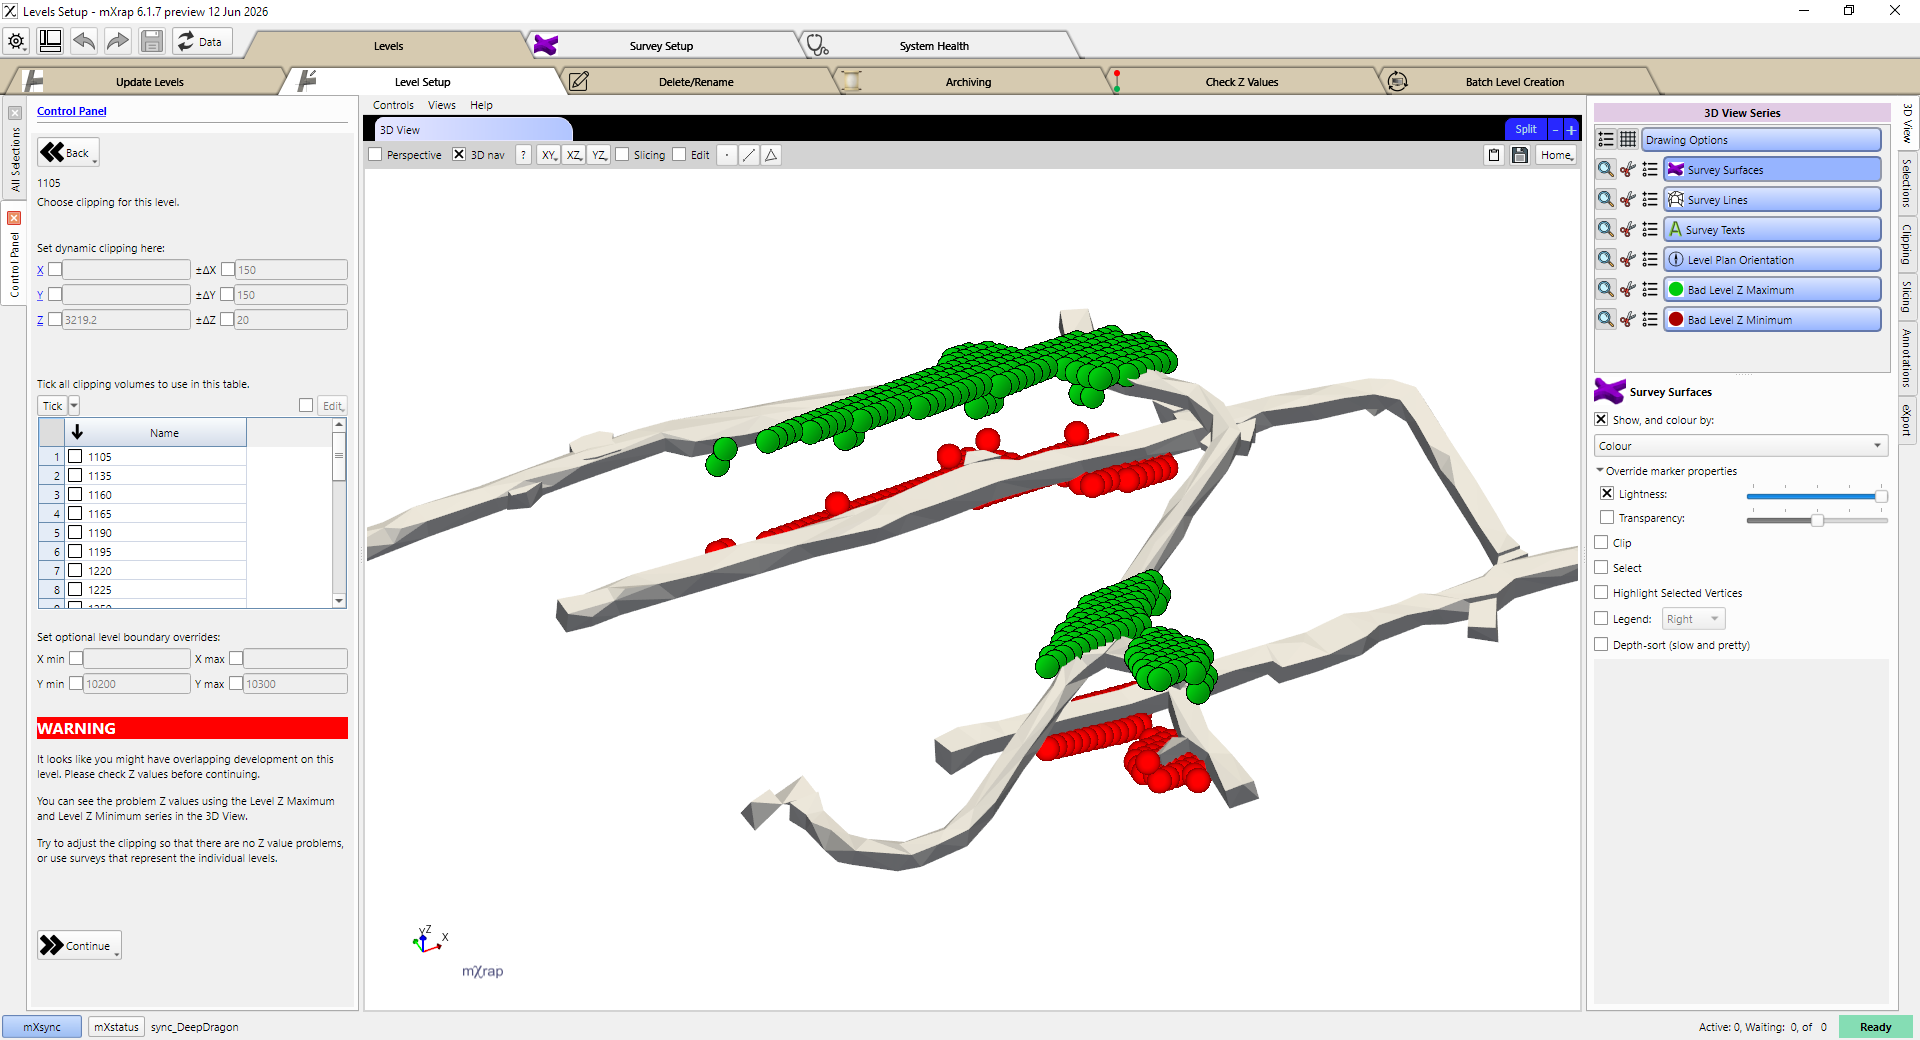
Overlapping development is a problem because of how the Z-value map is used to calculate the Z-values for lines. If we draw a line on the lower level in the inspections system but one end of the line is in the higher level of the Z-value map, then the line will go between two levels when viewed in 3D in mXrap, as shown in the image below.
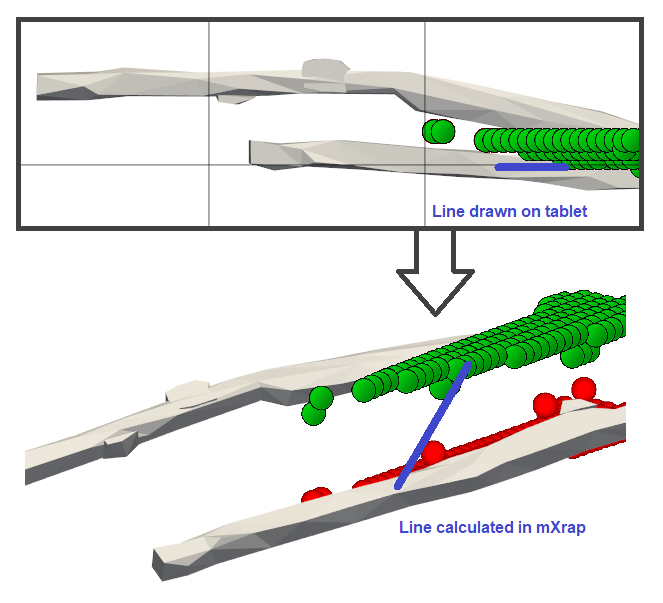
The line Z values are calculated dynamically when using the inspections app in mXrap. So, if you notice that some lines are showing up incorrectly then you can fix them by fixing the Z-value maps for their corresponding level. When you update a level the existing Z-value map for that level is completely replaced, so you just need to adjust the clipping or input surveys for that level to ensure that no bad level Z-values are generated during the update. You can investigate existing levels with bad Z-values using the Check Z-values window.
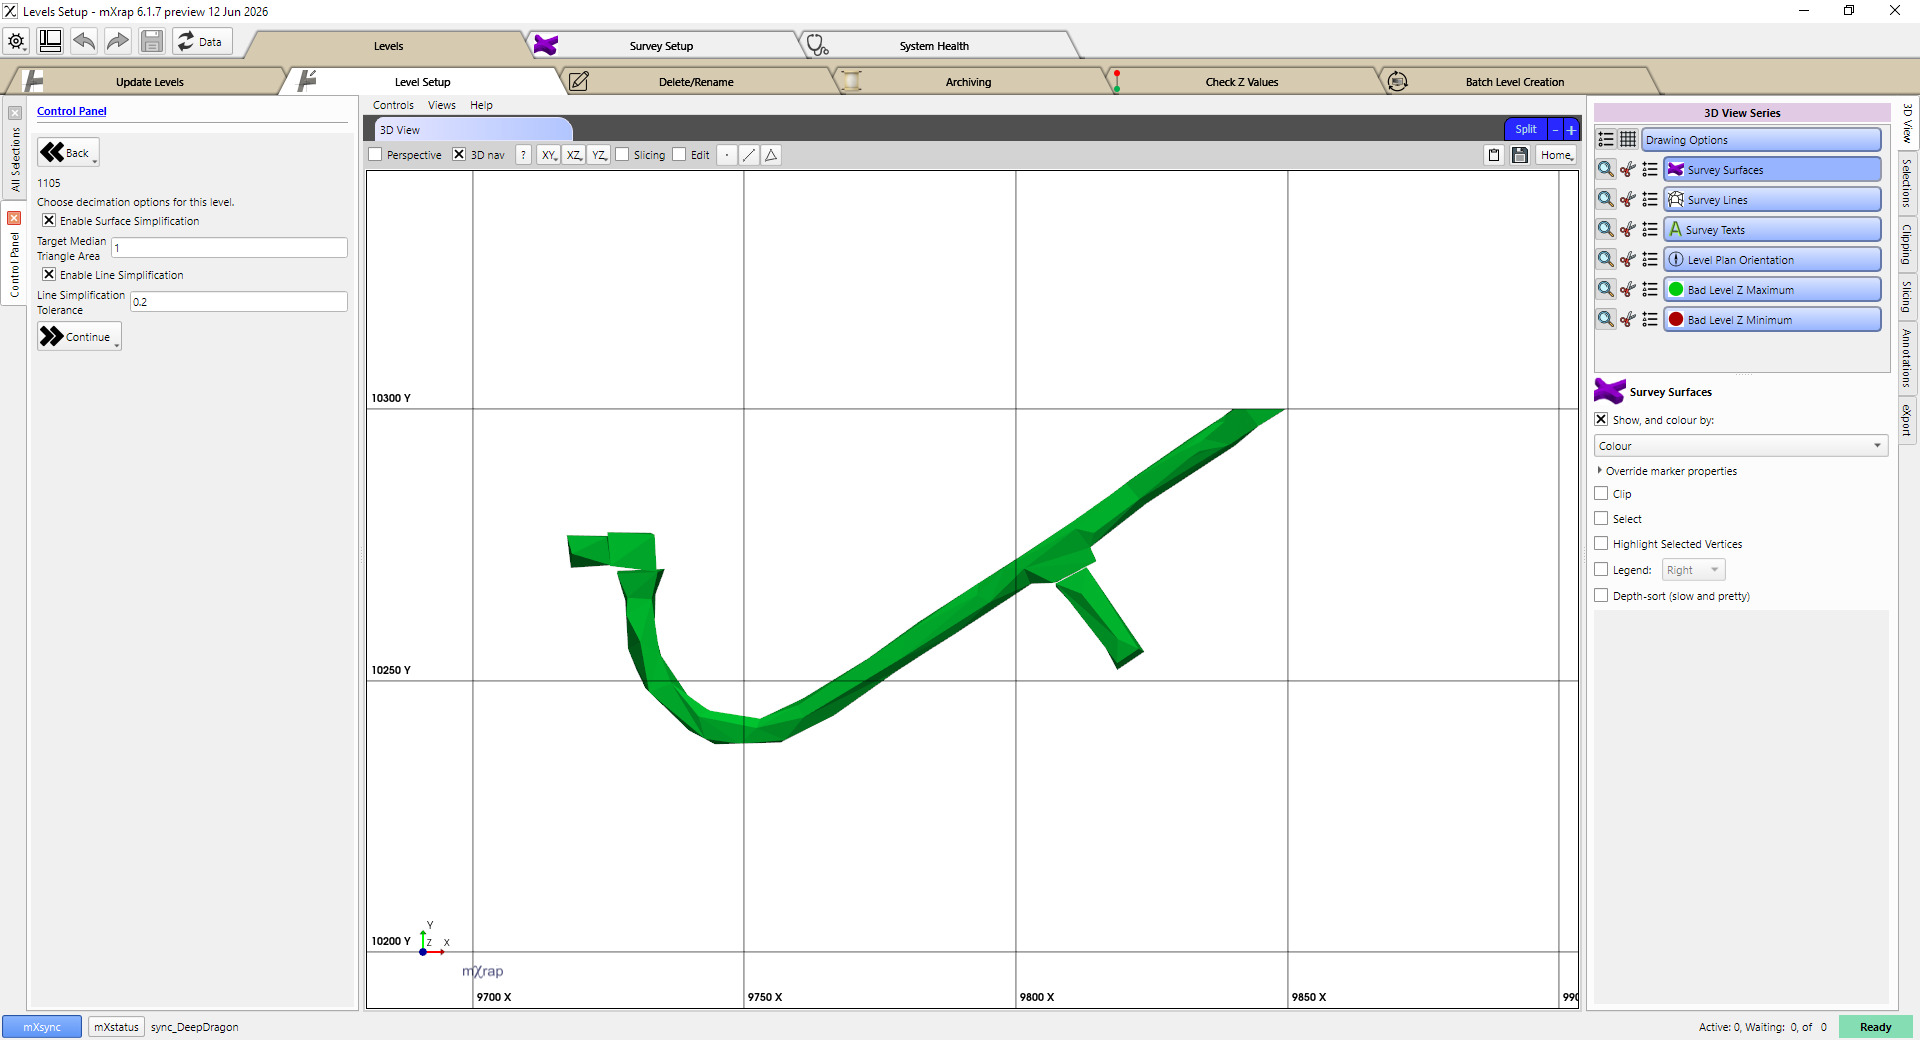
Setting decimation
The next step is to set decimation options for the level. The surface simplification option works differently to the regular survey import tool decimation. Rather than choosing a percentage of triangles to remove, you specify a median triangle area that you want to target. The system will then simplify the surface until the median triangle area is equal to or greater than your target. This is intended to produce consistent results despite varying density across different input surveys.
The resulting surface and lines will be downloaded by the inspections webform, and then rendered in real time on your device. Ensuring that the surfaces and lines are not overly complex is important so that the webform loads quickly and works smoothly when you are interacting with the level plans.
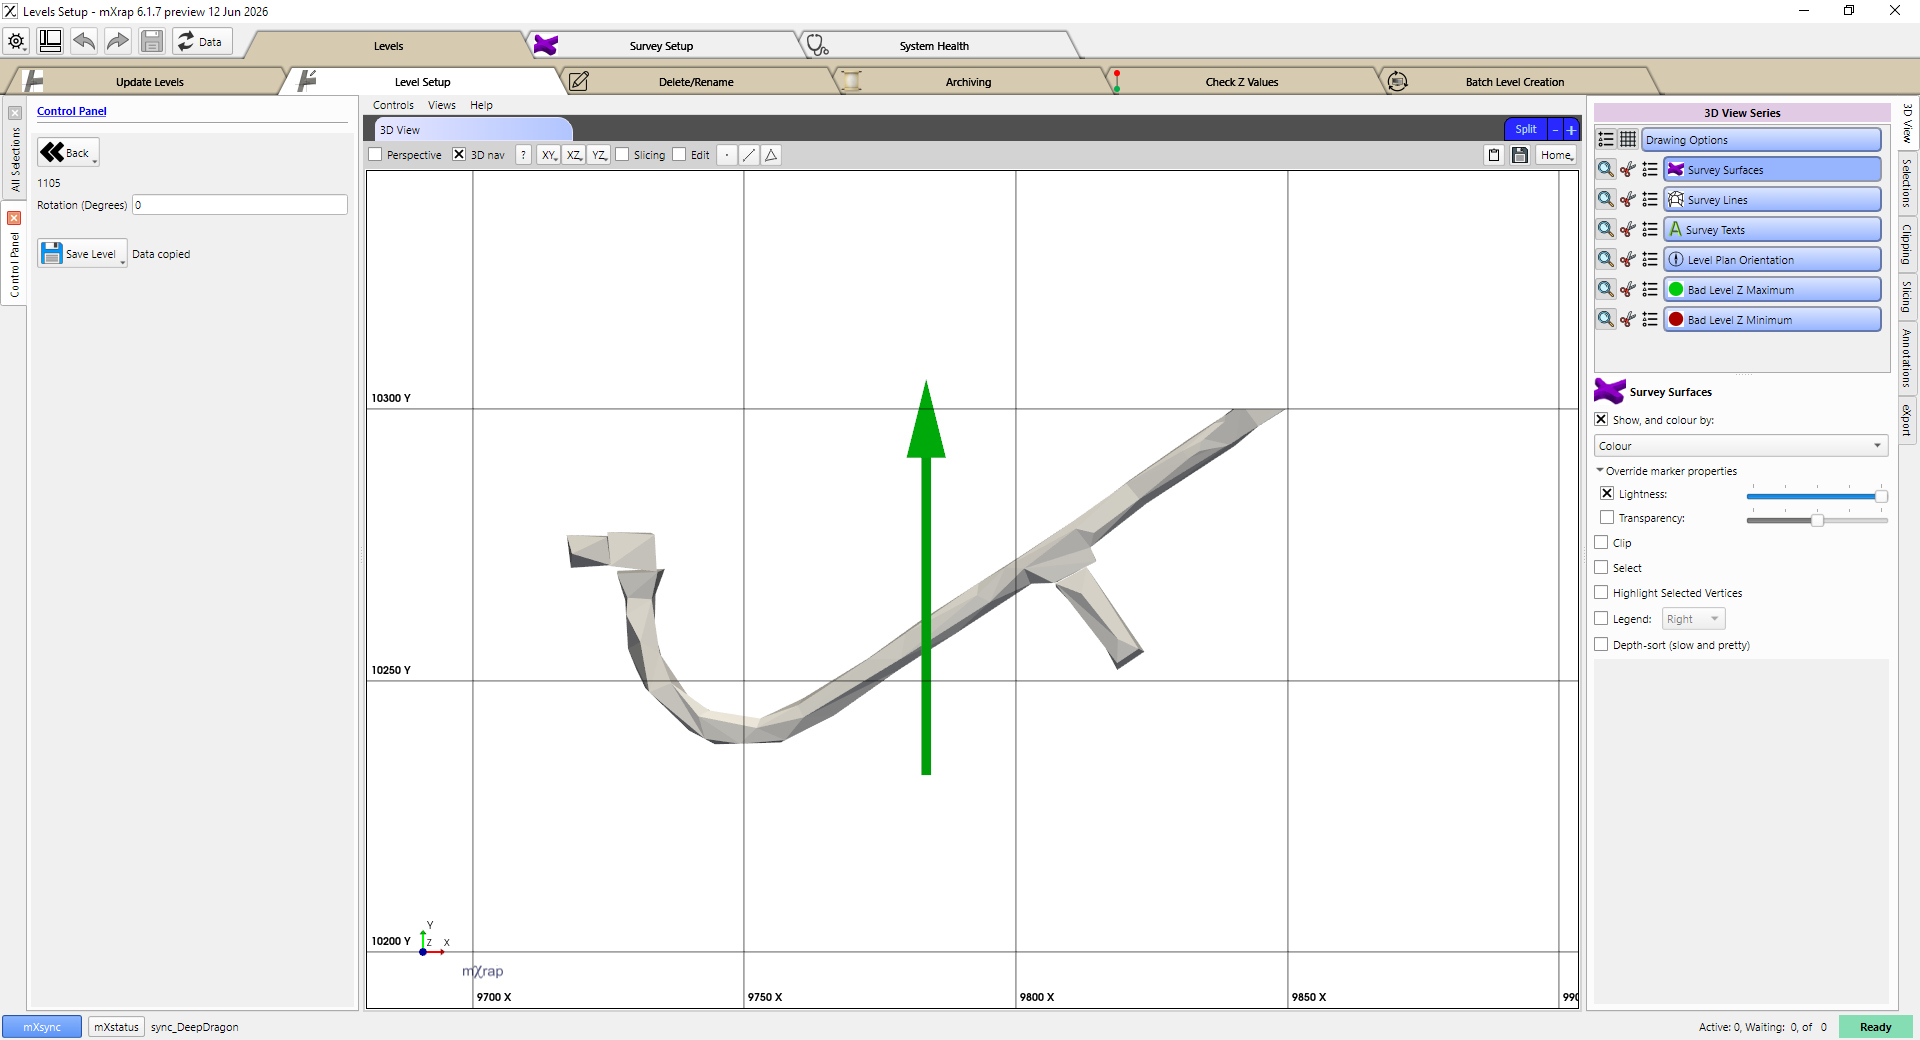
Set level rotation
In this stage you can set a rotation for the level, this determines the orientation of the plan view for this level in the webform. A green arrow will appear in the 3D view to indicate which direction will point towards the top of the screen when viewed in the webform.
When you are finished, click the Save Level button. All of the new level information will be written to the database. The 3D view should clear, and the control panel should return to its initial state.