Modelling
Parameter assignment
The three parameters available for prediction are:
- Rock Quality Designation (RQD)
- The log of the Q' value
- Index Test Results
The 3D view will display the results for whichever parameter is selected.
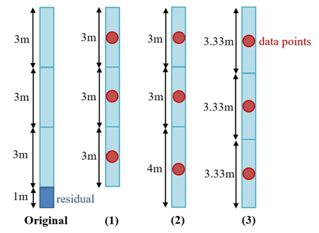
The interpolation processes use points in space which represent the borehole core measurements based on a Borehole Division approach. Each borehole is divided into intervals as per the Interval Length control, with the remaining core length either:
- Discarded so that all intervals are of the same length
- Added to the immediately previous interval
- Evenly distributed to the other core intervals
Adjust the Interval Length and select the remainder process, and a point will be assigned to the midpoint of each core interval with the measured parameters of that core piece assigned.
Interpolation
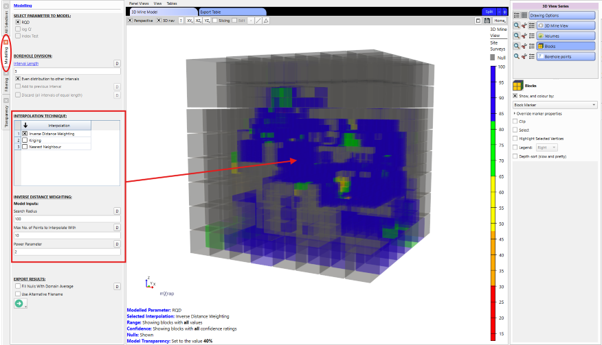
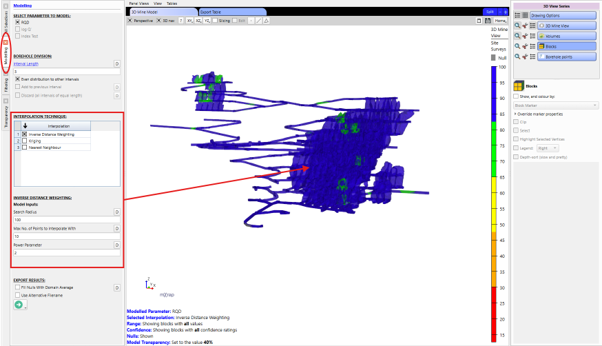
There are three available interpolation approaches in the model:
- Nearest Neighbour: Each block is assigned the value of the nearest known borehole reading within an adjustable Search Radius.
- Inverse Distance Weighting: Each block is assigned the weighted average of a defined Max. No. of Points to Interpolate With within an adjustable Search Radius. The weights are inversely related to the distances between the block centroid and the interpolated borehole readings. This can also be modified by entering an alternative distance-decay Power Parameter.
- Kriging: Each block is assigned the weighted average of a defined Max. No. of Points to Interpolate With within an adjustable Search Radius. The weights are decided using an Ordinary Kriging algorithm which fits the borehole readings to a spatial model (spherical or exponential) and solves the covariance matrix. For more information on the kriging algorithm, see: How Kriging Works | ArcGIS Pro documentation.
The results from interpolation can be viewed in the 3D view either in the block configuration or as reflected onto the site surveys. The results for all three parameters for the defined method of interpolation can also be viewed directly in the Export Table window. Only data points within the same domain as each block are used in its parameter interpolation.
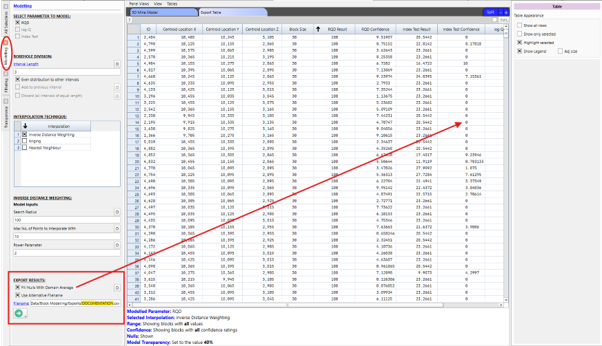
Export Results
The Export Table window contains a table with each block centroid's location, size, and assigned parameters with their corresponding confidence ratings (see Filtering and Transparency). This table may contain null rows due to a lack of borehole data within the defined Search Radius. Select Fill Nulls with Domain Average to fill all null rows in the table with the measured average of each parameter across the domain that the block lies in. These are given a confidence rating of 0.
Click the green arrow to automatically save the Export Table as a csv to #Standard Data/Block Modelling/Exports/Block Model_[Interpolation Type]_yyyy-mm-dd_hh.mm.ss.csv
within the mine site root folder. The location and name of the file can also
be personalised by turning on the Use Alternative Filename control and typing in the desired
location and name.
Filtering
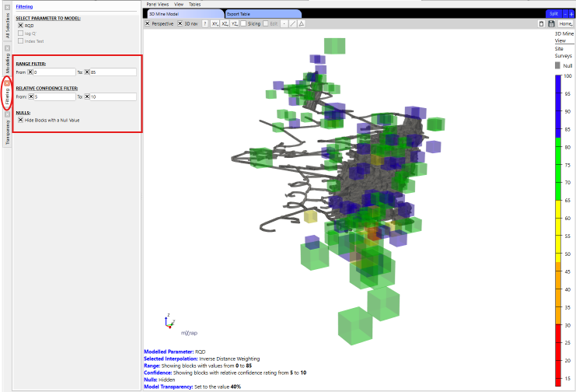
There are three filtering options available in a panel view in the modelling window:
- Range Filter: Entering a range From and/or To will only show the blocks whose interpolated parameter value falls within these boundaries in the 3D view.
- Relative Confidence Filter: Entering a range From and/or To will only show the blocks whose relative confidence rating falls within these boundaries in the 3D view. The relative confidence is a distance-based rating which rates blocks lower when located further away from the clusters of measured borehole data.
- Nulls: Turning on the Hide Blocks with a Null Value will hide the blocks who have not been assigned a parameter value in interpolation due to a lack of borehole data within the defined Search Radius. These filters are for viewing purposes only and will not impact the Export Table.
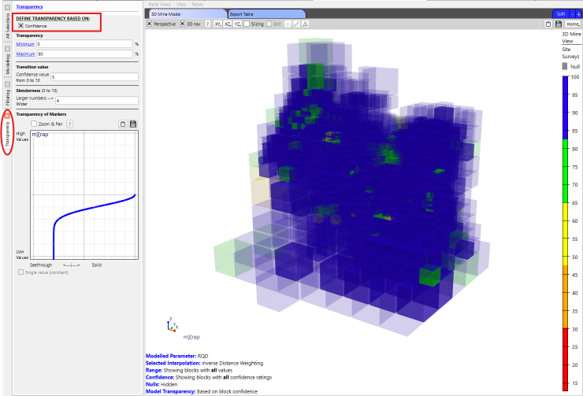
Transparency
In the transparency panel, select if the block transparency should be defined based on either a single fixed value between 0 and 100% or a confidence function. The confidence function relies on the Minimum Transparency, Maximum Transparency, Transition Value and Slenderness controls.